Author Topic: ESR meter input stage question  (Read 1445 times)

0 Members and 1 Guest are viewing this topic.

Offline JeanFTopic starter

  • Regular Contributor
  • *
  • Posts: 142
  • Country: fr
ESR meter input stage question
« on: January 20, 2019, 11:10:06 pm »
Hello,

I'm building an ESR-meter kit, for fun and as a learning experience, and I'm having a hard time understanding a particular aspect of its principle of operation. Could somebody please help me understand this ? :) I know some people like concise posts, unfortunately this one is not. You can jump straight to my question if you want, it is in bold red, at the end. The rest is some background, some details about what I've done so far. Thank you !

schematic: http://jfsimon.net/temp/esr1.png
assembly instructions (German): http://kripton2035.free.fr/Resources/ELV%20ESR1_KM_G_021017.pdf
same document, translated with Google Translate (I know nothing of German, sadly): http://kripton2035.free.fr/Resources/ELV_ESR1_English_web.pdf

Here is it what I think I understand (please correct me if I'm wrong)
A 555 is used as an oscillator, it is followed by two RC filters to produce a sine wave. The signal is amplified by T4. The test leads are connected at the test points BU1 and BU2. C11 removes the DC component of the signal. C12 blocks DC from the cap under test and avoids saturating the input of the amplifiers. The AC voltage at the point between C11 and C12 is amplified and rectified by IC5 and finally IC6 measures it and displays it. In the upper left part of the diagram is the circuitry for the automatic power-off.

(I am aware this is neither a precision instrument nor a true ESR meter, and rather a simple impedance meter, but that's not the point)

R24 and [the test leads and the DUT] form a voltage divider. I assume that, in first approximation, the part inside the square brackets can be modeled as an inductor, a resistor and a capacitor in series. The inductance would come primarily from the test leads, the capacitance would be from the DUT and the resistance would be the sum of the ESR of the DUT and the resistance of the test leads.

So if we call Vtest the voltage at the emitter of T4, then the voltage at the node between C11 and C12 (let's call it Vmeas) would be Vmeas = Vtest * Zeq/(Zeq + R24).
If the cap's capacitance is high enough, Xc is close to zero. If the inductance and the resistance of the leads is also negligible, then Vmeas = Vtest * ESR/(ESR + 100). If ESR << 100 Ohms, then ESR is roughly equal to Vmeas * 100/Vtest. As Vtest is constant, the circuit is nothing more than an AC voltmeter.

Am I still on track here ? :)

As I finished the soldering, I wanted to test the circuit and calibrate it.
It turns out that it's impossible to set the zero point when the (really crappy) test leads are not used. I shorted the terminals BU1 and BU2 with a short crocodile jumper and found that the adjustment range of the trimmer R6 is not large enough; I could only set the "zero" between 0.25 and 0.5 ohms. This particular ESR meter is far less popular than the Dick Smith one, but I still found one or two forum posts, in German, that were saying the same thing. And posters were advised to "use the supplied leads" because "it can't work otherwise". Sure enough, with the test leads soldered to BU1 and BU2, all other things being equal, the zero adjustment range is now 0 to 0.25 ohms. That's not ideal because 0.00 is barely in the range, -0.12 to 0.13 would have been easier to adjust. This kit has been available for many years, I guess in the past they were shipping another brand/length of test leads that were "spot on".
 
(Anyway, the leads I received are not the same as the ones on the product photo. They are of the crappiest kind, I can strech them by hand; the PVC coating is thick but the copper is AWG26 or 28 at best. I found a forum post where someone was complaining about the same thing.)

So obviously the impedance of the test leads is affecting the measurement. I was playing around with different test leads (the stock ones, random pieces of wire, speaker wire in various lengths, etc.) and finally I replaced R3, R7 and R6 with 1k, 1k and 5k respectively, to give me a larger range for the zero adjustment.

To have something to compare the values to, I bridged BU1 and BU2 with a very short piece of wire and soldered it. Then I adjusted the trimmer R6 to have 0.00 on the display. Then, I removed the wire and, without touching R6, bridged the two terminals again with other pieces of wire. (In the case of the ELV test leads, I firmly pressed the two probe tips together at the other end, and with the piece of coax, the core and the braid were soldered together at the remote end). Here are the results:


So when the length of the test leads increase, the measured value is actually decreasing! How is that possible? If my reasoning was correct about the voltage divider, I think it should actually increase instead. Can someone point me in the right direction? I probably have missed something elementary somewhere, but I can't find what. Thank you!


By the way, I also tried with some speaker wire, in three different lenghts (each time, the two conductors were soldered together at the remote end) just to check, and it confirmed that the measured value is decreasing linearly with the increase in length.

Bonus question: what's the purpose of C22? Why is that trace between C11/C12 and C22 kept completely floating? I would have thought that C11 and C12 could be enough to remove the DC bias at the input of IC5's first amplifier.

Thank you very much for your help :)


Offline JeanFTopic starter

  • Regular Contributor
  • *
  • Posts: 142
  • Country: fr
Re: ESR meter input stage question
« Reply #1 on: January 28, 2019, 11:30:56 pm »
Hello again,
Since last time, I have spent quite some time trying to figure out what's going on with this circuit. I'm still not 100% sure so if you have any comments, suggestions or answers to my questions, please feel free to post; I would very much appreciate it.

So as a quick summary, I found out when building this kit that:
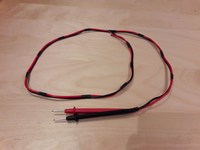
● the test leads are an important part of the circuit. Without them, or with other leads that are too different from those that were included in the kit, it is impossible to zero the meter. This is, IMO, not clearly stated in the manual, but some German forum posts mention it.
● one can solve this issue by swapping two resistors and a trimmer, thus allowing the use of custom test leads.
● The manufacturer recommends to tape the two test leads together to minimize their inductance. I think tape looks messy; cutting the banana jacks allows to use heat shrink tubing instead, which is neater but still not pretty.
● That made me think about using flat/parallel wire (such as speaker wire) instead, in order to have the two conductors neatly attached together.
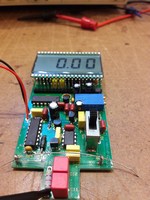
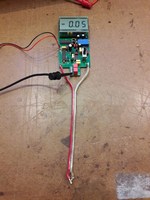
● I was playing around with a few pieces of speaker wire as improvised test leads, and was looking at the displayed value when  measuring a direct short (i.e. a solder bridge at the end of the leads).
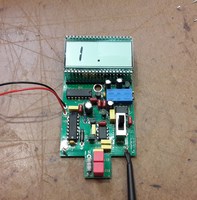
● I noticed that increasing the length of them actually decreased the displayed value; which I found very peculiar. I was thinking that increasing the length would increase the inductance of the test leads, thus increase their inductive reactance, and that the displayed value would increase because this simple meter is just an AC voltmeter, not a vector meter, so I think it cannot differentiate between ESR, capacitive reactance or inductive reactance. The meter was previously calibrated to 0.00 with the test points shorted by a piece of wire, then the trimmer was not touched again.


Here are the results:


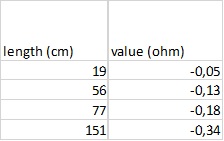
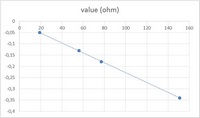
Let's call this situation "Case 1"

What's up next?
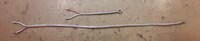
Then, to double-check, I made three makeshift inductors with some ordinary hookup wire. They have 2, 4 and 7 turns respectively. I don't have a LCR meter but I know for sure that inductance goes up with the number of turns. So this time I used short alligator jumpers (they were taped to the bench to minimize geometry effects) and measured their impedance with the ESR1 : (Case 2)


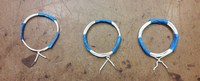
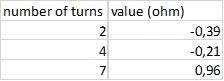
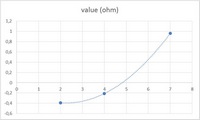
What the... ? This time, the measured value increases with inductance. I expected that, but that is contradictory with Case 1.

Finally, I wanted to cross-reference Case 1 and Case 2. So this time, I measured the same coil each time (I randomly chose the one with 7 turns) but with different lengths of speaker wire. (The solder bridge was removed first, of course) (Case 3)


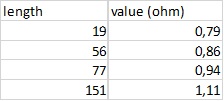
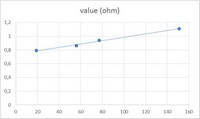
In this case, the measured value (the DUT stayed the same) increases with the length of the leads. Again, this seems contradictory with Case 1.

Of course, all of that doesn't stop me from using this device (or not using it, if it turns out to be a not-so-useful gadget). I just would like to understand what's happening. Does anyone have a clue ? I would be glad to hear your thoughts about that. (Why Case 1 is different from 2 and 3).

As my first post has not been particularly successful, I continued to tinker.

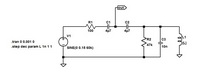
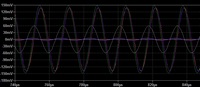
I used LTSpice to try and simulate the input stage of the meter. I am a beginner w.r.t. LTSpice as well. The value of L1 (representing the test leads shorted together, in Case 1) was stepped between 1nH and 1H (as I had no idea of realistic values, I used a very broad range). I observed the output signal at the node between C11 and C12. According to the simulation, for small values of L1 the output amplitude is first decreasing, then there seems to be a cusp, and then the output amplitude is increasing with the increase in inductance. As I didn't know how to do it directly in LTSpice (is this possible ? If anyone knows, I would really appreciate it), the values were exported to Excel, then I computed the RMS value of each sine and then I plotted the RMS value against the inductance. I also simulated the case when L=0 (dead short between BU1 and BU2, as it was the case during calibration, see the photo above)


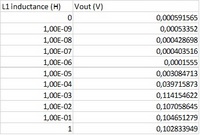
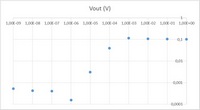
The last plot looks like a band stop filter. So I figured out that the combination of C12, R27, C16 and L (the slightly inductive test leads, shorted together) form a complex filter which can, for some values of L, pull more of the signal to ground than C12 alone could. And the last plot would explain why for small values of L, the value is first decreasing with the increase of L, then increasing after the turn-back point. That would account for the discrepancy between Case 1 and 2/3.

Am I correct ? How would you have done it? Again, even if you don't have definitive answers, I would be glad to hear your comments. How is it possible that, for some values of L, the impedance of C12, R27, C16 and L, toghether in their series/parallel combination is smaller than the impedance of C12 alone ? As C12 is in series with (R27 // C16 // L), this doesn't feel natural to me. I am a bit rusty with the combination of multiple complex impedances; if you have some tips to deal with that kind of problem more efficiently, please point me in the right direction!

By the way, the bonus question at the end of my 1st post still stands! Anyone ?

As a side note: in the final product I will be using much thinner speaker wire; this one is way too thick and stiff. But this is what I had on hand for testing.

Thank you again !
JF

« Last Edit: January 28, 2019, 11:43:49 pm by JeanF »
 

Offline floobydust

  • Super Contributor
  • ***
  • Posts: 6956
  • Country: ca
Re: ESR meter input stage question
« Reply #2 on: January 30, 2019, 05:43:58 am »
I can't answer all your questions but perhaps some ideas.

The ESR meter circuit uses the ICL7106 differential inputs to subtract out or null the test lead resistance.
The ICL7106 has limits for this common-mode voltage it can work with.
Datasheet range is (V- + 1V) < VIN < (V+ - 0.5V) Missing on the schematic are pin 26 GND and power pin 1, assumed to be 9V and 0V.
So the common-mode voltage seen by the IC must be at least 1V above ground. This is at the IN LO and IN HI pins.

Lower resistance test leads give less offset and I'm guessing R6 is then set too low, to giving below 1V at IN LO pin 30.
This is out of spec for the A/D so it misbehaves and give wonky readings.
IN HI (the rectifier output) should be 1.03V at rest, assuming the 2.5V rail is perfect. It might be a bit low too.

You can prove the theory by simply adding offset, setting your zero reading to say 10.00 (ensuring pin 30 is at least 1V or a bit more) and repeating some of your tests. This will tell if the A/D is the limiting factor with this circuit approach to nulling out the test lead resistance. A fix could be to nudge up the 2.5V rail enough to allow low test lead resistance to work, by lowering only R1. The low battery trip point R2,R10 would need to be adjusted as it would be out then.

C22 is part of a high-pass filter for filtering out mains hum, which will come in on the test leads. C22 22nF, R32 22k gives 328Hz.
You only want to look at 60kHz and not have 50/60Hz giving silly readings.

Your Spice simulation may showing a near resonance occurring between L1 and C3, which happens at 60kHz with L1=704uH.
The OUT node is loaded down (by R32 through C22) so a 2k2 load I would add there.
In real life, the inductor L1 has some DC resistance along with the test leads. I'm not sure if you have values entered. C1 and C2 have a tiny amount of lead+PCB inductance as well, maybe 10nH each.
 

Offline JeanFTopic starter

  • Regular Contributor
  • *
  • Posts: 142
  • Country: fr
Re: ESR meter input stage question
« Reply #3 on: February 25, 2019, 09:53:13 pm »
Thank you very much for your detailed answer. I was forced to stay away from the bench and I'm really sorry I haven't been able to reply earlier. Please don't take this delay personally, I very much appreciate your help!

Yes power pins 1 and 26 are indeed 9v and 0v.

When the impedance of the test leads is small, the voltage at the node between C11 and C12 (oops, I should have kept the same designators in my LTSpice, sorry about that, will fix that for the next one) does not increase with the said impedance. Thanks for the tip about the common mode voltage range on the 7106 inputs. I will study its datasheet in more detail. Not an easy task for me as I have no prior experience with ADC technology :)

I dont think this is the issue though, as with this arrangement of R1,R3,R7,R9,R6 the voltage at IN LO pin 30 could in theory be adjusted between 2.486V and 2.513V (with a perfect 5V rail and R1,R9=22K ; R3,R7=220R, R6=500R). In order to be able to set the zero with a broader range of leads, I changed R3,R7 to 1k and R6 to 5k, this gives a theoretical range of 2.421 V to 2.579 V. In practice I measured 2.45->2.61 on my unit, that's about 1% off, probably due to the tolerances of the resistors and the 5v regulator.

So I think these voltages are well within (V- + 1V) < VIN < (V+ - 0.5V) ? Or have I got it wrong?

How did you find 1.03V at IN HI, and what do you mean by "at rest" ? I wanted to reproduce your calculation but I couldn't.

Lowering R1 could also work, but then I would have to change R2 and R10 as you said so it's on par with changing R3/R7/R6 (well, it would save the cost of R6 and one solder joint but that's not a big deal). I think the "problem" (it was not a huge one) is fixed now, my goal when I posted all this was mainly to try to understand the issue as best as I can, even though the device is usable as is.

About offset... I think you mean also putting a 10R resistor in series with the leads? With R6 alone I can only offset the display between -0.29 and 1.25 (which is fine as 0.00 is in the range ; before I swapped R3/R7/R6 it was 0.25->0.51)
With a 10R resistor in series with the test leads, and with the display adjusted to 10.00 using R6, I repeated my tests (shorting the leads together and measuring the influence of their length on the measured value, here is what I got:

Does that makes sense? In this case the circuit behaves as one would expect (longer leads->more inductance->more voltage), as it was in Case 3 (2nd post), but this time the slope is 10x less, to the point that the effect of test lead length appears almost negligible! Is this what you would expect? Besides, I tried to link this reading with the previous graph I made last time. An inductor having 10ohms of reactance at 60kHz would be 26µH. That falls in the red zone of the chart.


Thank you for the tip about C22 ! :) I should have revised my active filters ! I didn't see a filter at the first glance because I was kind of expecting to see the output of it between R and C, as in passive filters...

I will play around more with Spice and use your advice. Would a 2k2 resistor to ground be equivalent to the arrangement of R32 in the real circuit, even though neither end of R32 is grounded in this case? I will add the DC resistance and the parasitic inductance of the caps as well. I just found out about the .MEAS directive, that just saved my day, because in the past I was exporting the raw values in Excel and computing the RMS value in there; it will be much quicker now with .MEAS.

Anyway thanks again for your help. What do you think, is it more a problem of bad readings in the low range due to something I haven't thought of yet, or more like just LC resonance of L/C16/C12 effectively pulling the test signal to ground ? When I add offset as floobydust suggested, and measure a short, the effect of test lead length is less significant than in Case 3 where I was using the same set of speaker wire pieces (same lengths) to measure an (unknown) inductor. Is this what you would expect, and how can this be explained analytically?

Thanks again.
Cheers, JF


Share me

Digg  Facebook  SlashDot  Delicious  Technorati  Twitter  Google  Yahoo
Smf