Author Topic: Keithley 2015 + RS232 = frequency response chart ?  (Read 2486 times)

0 Members and 1 Guest are viewing this topic.

Offline jimonTopic starter

  • Regular Contributor
  • *
  • Posts: 159
  • Country: se
Keithley 2015 + RS232 = frequency response chart ?
« on: February 09, 2015, 08:21:29 pm »
Hi, I've finally got RS232-USB cable, 1.88$, 2x cheaper then one ride on a bus here in Sweden :scared: And I also have nice looking Keithley 2015. I've checked connection, it actually works, ":DATA?" do return me current data :-+

And I saw a lot of promo materials show nice graphs like this :


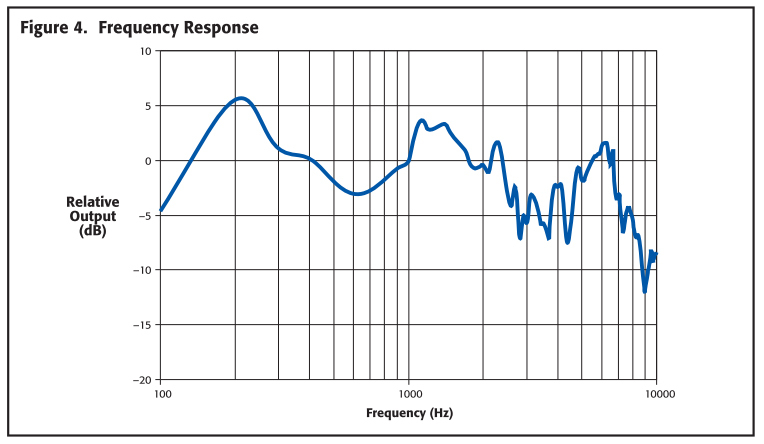
So, how one can do this graphs actually ? Is there a software to do it ? (I haven't found actual software from Keithley). Or should I just write little app with Qt ?

PS. Is there list of all available scpi commands for this device ?
« Last Edit: February 09, 2015, 08:24:07 pm by jimon »
 

Offline 2bluesc

  • Contributor
  • Posts: 16
Re: Keithley 2015 + RS232 = frequency response chart ?
« Reply #1 on: May 13, 2017, 06:12:16 pm »
Did you ever find an answer?  I'm looking at building something similar in Linux (maybe Sigrok does something already?) using python or something.
 

Offline tooki

  • Super Contributor
  • ***
  • Posts: 11473
  • Country: ch
Re: Keithley 2015 + RS232 = frequency response chart ?
« Reply #2 on: May 14, 2017, 04:38:29 pm »
I know you can do it with things like Matlab, and almost certainly with LabView.
 

Offline Muxr

  • Super Contributor
  • ***
  • Posts: 1369
  • Country: us
Re: Keithley 2015 + RS232 = frequency response chart ?
« Reply #3 on: May 15, 2017, 05:32:27 am »
As long as you can capture data you should be able to chart it yourself. Python has tons of charting libraries.. https://lisacharlotterost.github.io/2016/05/17/one-chart-code/

There is an example of a logarithmic chart on that link, like the one you'd use for audio frequencies.


Share me

Digg  Facebook  SlashDot  Delicious  Technorati  Twitter  Google  Yahoo
Smf