Author Topic: DMM linearity comparison  (Read 30748 times)

0 Members and 1 Guest are viewing this topic.

Offline e61_philTopic starter

  • Frequent Contributor
  • **
  • Posts: 962
  • Country: de
Re: DMM linearity comparison
« Reply #50 on: November 02, 2018, 07:46:12 am »
What about a 10V step after each (or several) measurement points? This way one could reduce drift effects.
 

Offline Kleinstein

  • Super Contributor
  • ***
  • Posts: 14192
  • Country: de
Re: DMM linearity comparison
« Reply #51 on: November 02, 2018, 10:57:15 am »
A repeated 10 V step in between would complicate the way to look at the results, as different scaling would be used. It might also add some noise. Another point is that it can upset self heating effects and might thus need longer waiting time than. relatively small steps help with thermal settling a little.

I think just a few repeated runs (e.g. 3-6) should be good enough to see and with averaging also suppresses much of the drift effects.
However there is also a little downside: if there are more DNL like errors on the small scale, like jumps in the INL curve, these might also be smoothed out in some cases.

I personally would prefer something like 0.5 V steps and thus about 20 data points in the curve.

I don't think the curved shape is an effect of drift. It repeats in several runs and seem to be related to the 5540.
 

Offline Pipelie

  • Regular Contributor
  • *
  • Posts: 172
  • Country: cn
Re: DMM linearity comparison
« Reply #52 on: November 04, 2018, 05:43:35 am »
I modified the script and took 51 runs last night. the setup of 3458 is 10V,50NPLC, and each run takes 10 minutes.

there are only 5 runs within +/-0.1ppm INL span, and 26 runs within 0.15ppm (peak to peak).

all in all,  the shape of the curve is identical.
 
The following users thanked this post: lukier

Offline Kleinstein

  • Super Contributor
  • ***
  • Posts: 14192
  • Country: de
Re: DMM linearity comparison
« Reply #53 on: November 04, 2018, 08:48:05 am »
The 0.5 V point looks a little odd. I would guess this is an effect of the source, as 0.5 v should be nothing special for the ADC. It the calibrator still using the same range, ore going to a lower range ?
 

Offline Pipelie

  • Regular Contributor
  • *
  • Posts: 172
  • Country: cn
Re: DMM linearity comparison
« Reply #54 on: November 04, 2018, 11:28:20 am »
yeah, that's odd to me too. if you look close in my previous posted reply #44 and #46, you will find out they all look odd at 0.5V point.

I don't think the calibrator using the lower range at 0.5V, because the low range using the different output binding post call divider output. :)


Offline TiN

  • Super Contributor
  • ***
  • Posts: 4543
  • Country: ua
    • xDevs.com
Re: DMM linearity comparison
« Reply #55 on: November 12, 2018, 11:23:57 pm »
Time to bump the thread, eh? I'm currently away in Japan, but it doesn't mean I can't voltnut meters over the internet thru GPIB tunnels. ;D
Testing MM's 4808 calibrator (uncalibrated) versus his 3458s for DCV INL.

Data sampled every 1% step from -110 to 110% of the scale. Both meters configured NPLC100, DELAY0, AZERO ON and ran DCV ACAL before test start. Data might be still compromised by aircon, as it's kinda wobbly during the sweep. Purple and green charts are direct INL of the meter vs calibrator's programmed value. Orange line is difference between two 3458A's used in the test. Each step have soak time 20 second after programming calibrator output to allow settling. Configuration for calibrator  : S0R6F0O1=.

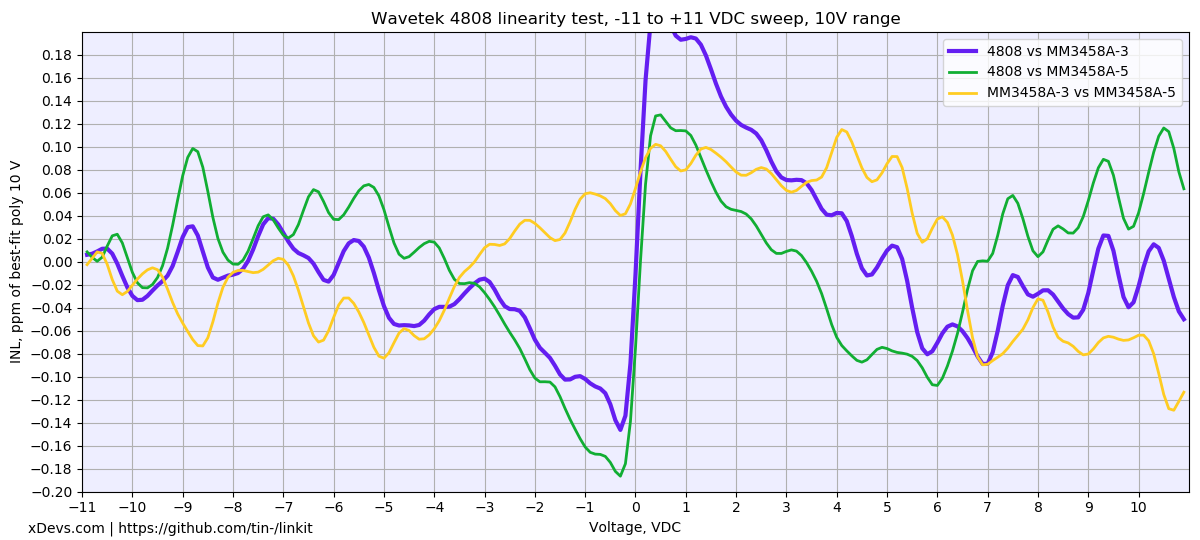
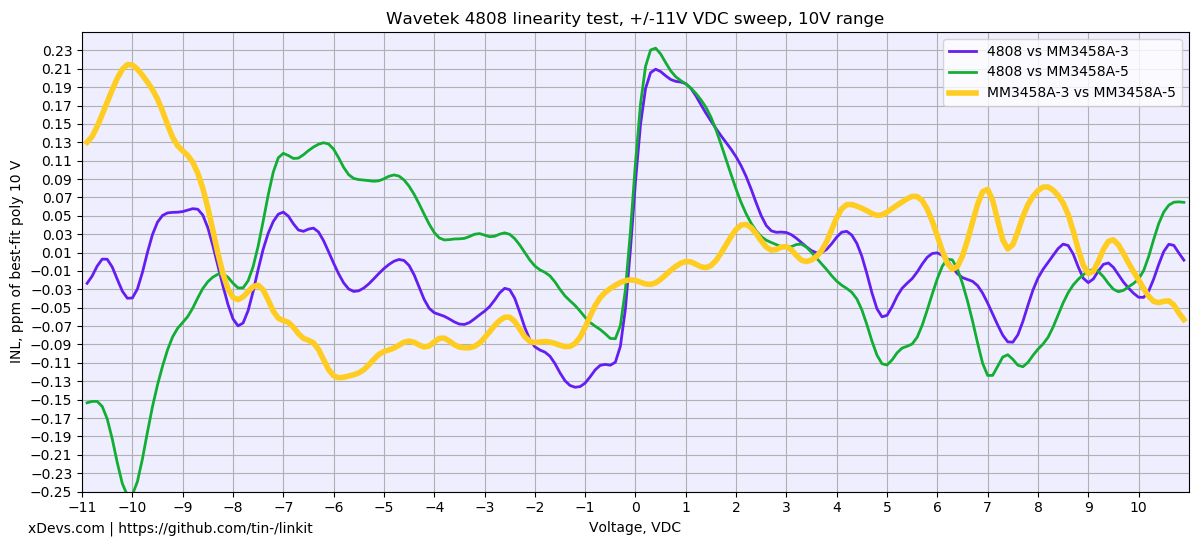
10V sweep. About +/-0.2ppm INL over the span. Delta INL between meters <+/-0.12ppm (should be at least twice better, so perhaps more tuning for settings can be done). Could be also cabling issue or thermal EMF offset, to cause the zero crossing jump. I'm not very familiar with 4808 INL performance to judge now.


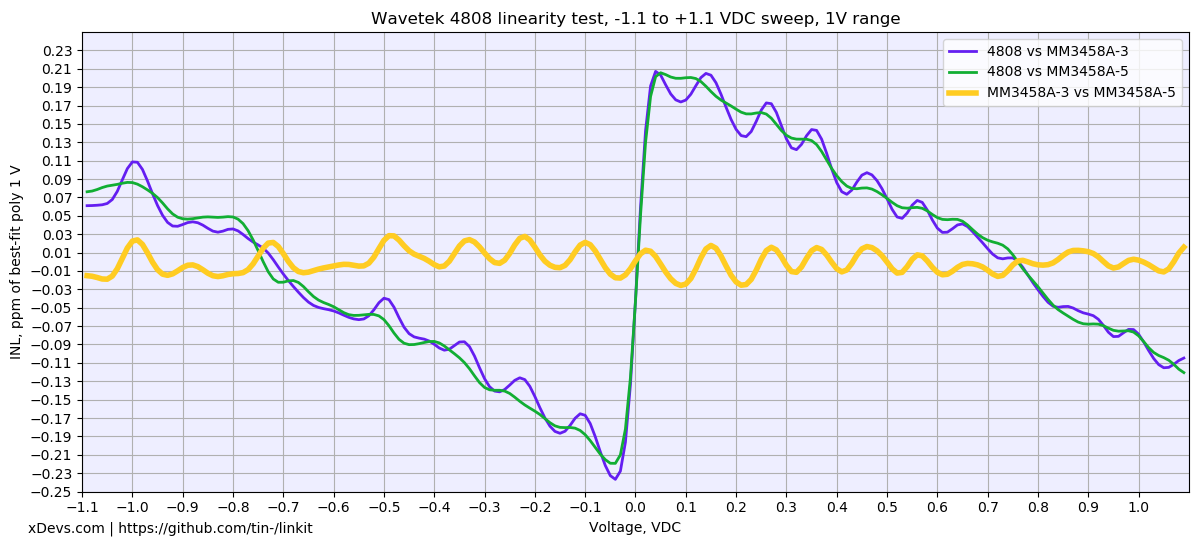
1V sweep is more interesting, in respect of delta INL between meters :)


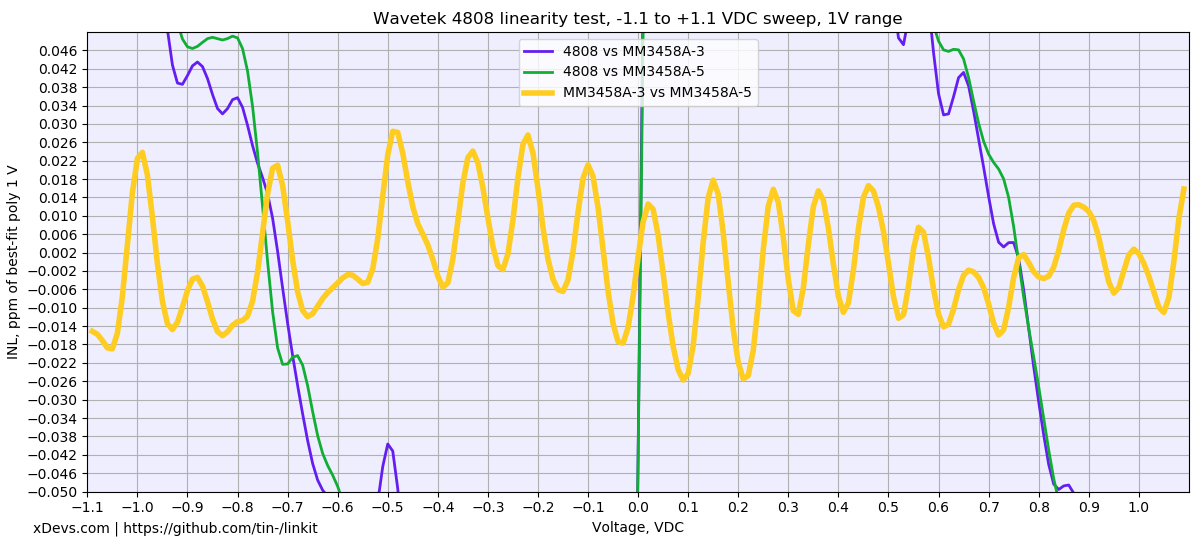
Same dataset, but zoomed in ppm INL scale to +/-0.05 ppm. I'd say +/-0.03ppm in full -1.1 to +1.1V sweep is impressive  :-+.


Now running 100mV test.


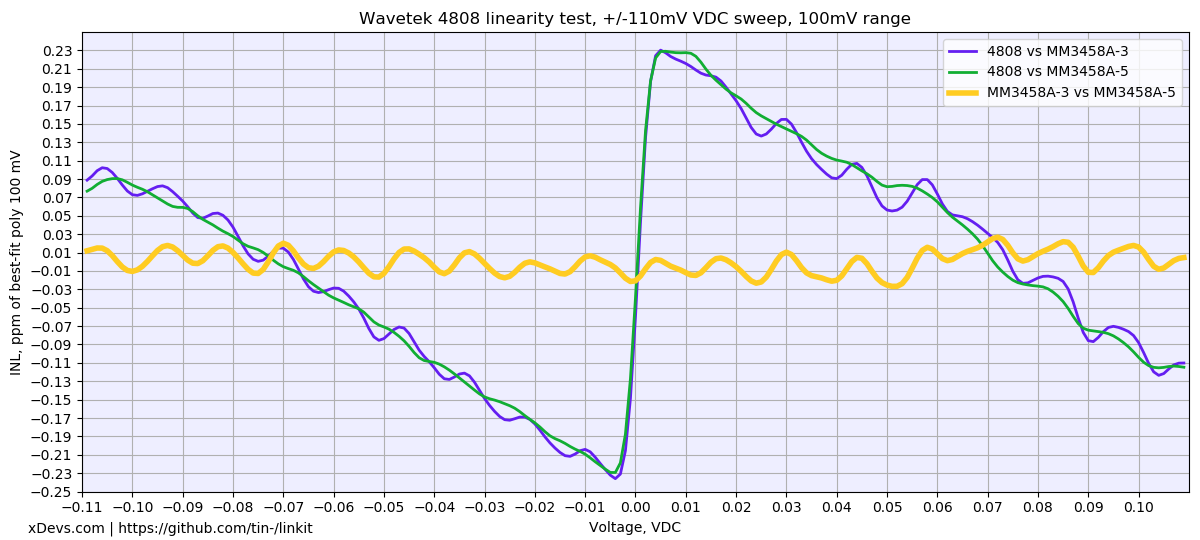
About same as 1VDC sweep, with max INL error +/- 0.03 ppm. Chicken dinner winner.

Retest 10V again, with NPLC50 instead of 100 now:


And 100V INL sweep:


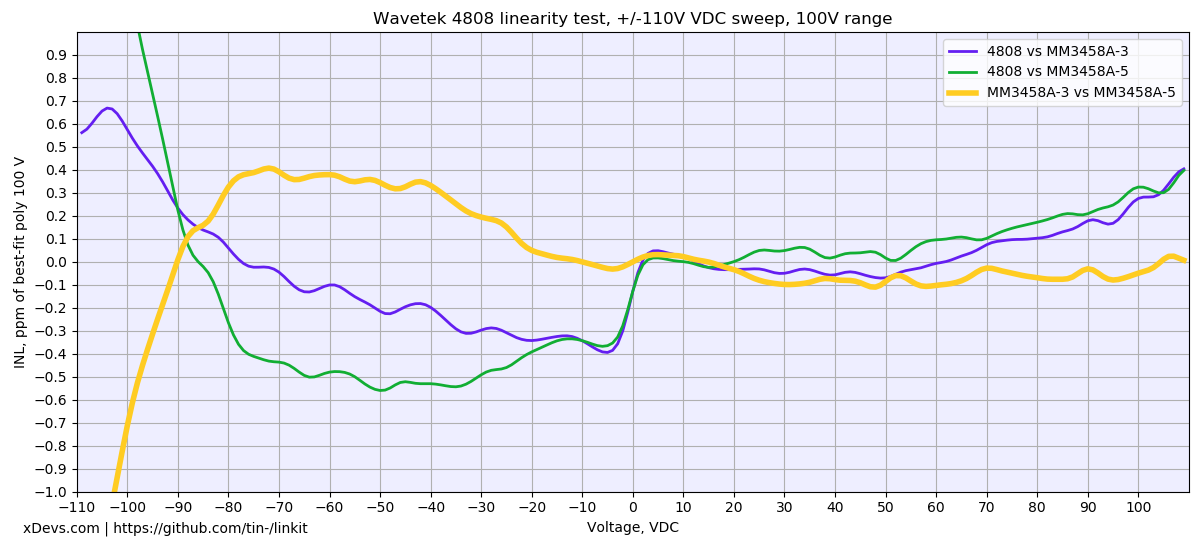
Negative polarity is somewhat strange. There is ~40 second delay on each 1V step, so it's hard to tie that just on self-heating errors of the HV divider.
« Last Edit: November 14, 2018, 04:40:37 am by TiN »
YouTube | Metrology IRC Chat room | Let's share T&M documentation? Upload! No upload limits for firmwares, photos, files.
 
The following users thanked this post: ManateeMafia

Offline macboy

  • Super Contributor
  • ***
  • Posts: 2254
  • Country: ca
Re: DMM linearity comparison
« Reply #56 on: November 13, 2018, 05:10:14 pm »
Any data on Keithley 2001? It's 7.5 digits (20 000 000 count) with a spec of 1 ppm typical and 2 ppm max INL. I'd like to see real data though.
 

Offline TiN

  • Super Contributor
  • ***
  • Posts: 4543
  • Country: ua
    • xDevs.com
Re: DMM linearity comparison
« Reply #57 on: November 14, 2018, 04:41:19 am »
21M count actually. Got rid of all 2001's, so can't do a test :)
YouTube | Metrology IRC Chat room | Let's share T&M documentation? Upload! No upload limits for firmwares, photos, files.
 

Offline TiN

  • Super Contributor
  • ***
  • Posts: 4543
  • Country: ua
    • xDevs.com
Re: DMM linearity comparison
« Reply #58 on: November 15, 2018, 10:59:20 am »
Few more sweeps with NPLC20 and NPLC20 with short delay (2s instead of 20sec):


Short delay times, same NPLC20:


Perhaps it's safe to assume that long NPLC100 not required to do INL test with <0.1ppm data between 3458A's.  :)
YouTube | Metrology IRC Chat room | Let's share T&M documentation? Upload! No upload limits for firmwares, photos, files.
 

Offline Kleinstein

  • Super Contributor
  • ***
  • Posts: 14192
  • Country: de
Re: DMM linearity comparison
« Reply #59 on: November 15, 2018, 01:34:14 pm »
For the linearity tests it might need some time for the points to have the source and meters in thermal equilibrium. So especially the first point or so should have some soaking time, of maybe 1-5 minutes.  The later points are a little less critical, as the steps are relatively small. Having the data well away from stable temperature is a different thing and adds the time as another variable.
With only 2s per point and some 40 points per curve one might still be a little on the fast side, so that the source and meters may not be in stable state. I think the 20 seconds were reasonable.  One could alternatively use a few more points - this might help to get a noise estimate. Especially with higher voltages there is likely quite some noise - alone from the references in the source and meter.
If one has to wait a little longer at each point, one could as well use longer integration or take a few more points.

I think the spline / polynomial curve is not a good way to show the data. Individual symbols and maybe additional connecting lines should be the better choice.

It might also be a good ideal to have at least 3 runs to get an idea how reproducible the curves are. There is superimposed drift and maybe significant noise.

Some of the INL contributions (especially effects from the rundown) can be higher with short conversions, like 1 PLC. So there might be a difference between a single 100 PLC conversion (internally maybe done as average of 10 PLC conversions) and the average of 100 conversions at 1 PLC each. This test could be even done without a super stable source.
 

Offline TiN

  • Super Contributor
  • ***
  • Posts: 4543
  • Country: ua
    • xDevs.com
Re: DMM linearity comparison
« Reply #60 on: November 15, 2018, 02:19:13 pm »
Thank you, Kleinstein, interesting view as well. I was already thinking about making 0.01V steps on 1V instead of 0.1V. Running now 60second NPLC200 sweep first.
3458A internally does not do any samples faster than 10NPLC, but using blocks of 10NPLC measurements (signal + zero if enabled) to give longer "NPLC" results.

I'll add multiple runs later on too.
YouTube | Metrology IRC Chat room | Let's share T&M documentation? Upload! No upload limits for firmwares, photos, files.
 

Offline e61_philTopic starter

  • Frequent Contributor
  • **
  • Posts: 962
  • Country: de
Re: DMM linearity comparison
« Reply #61 on: November 15, 2018, 03:16:08 pm »
I would also take a couple of measurements until a certain stability is reached. With the Fluke 5440B and the 3458A it took some measurements (at 100NPLC) to settle.
 

Offline TiN

  • Super Contributor
  • ***
  • Posts: 4543
  • Country: ua
    • xDevs.com
Re: DMM linearity comparison
« Reply #62 on: November 16, 2018, 01:18:30 am »
Here is Python app used to log data from both meters and control W4808 calibrator.
You can see there I take 15 readings:

for ix in range (0,15): #take more samples

 and then use last 5 readings median (median = np.median(array[5:])) as final data on each step.
YouTube | Metrology IRC Chat room | Let's share T&M documentation? Upload! No upload limits for firmwares, photos, files.
 

Offline acts238willy

  • Regular Contributor
  • *
  • Posts: 95
  • Country: us
Re: DMM linearity comparison
« Reply #63 on: November 16, 2018, 01:49:52 am »
Question...
I have six 732As and a 732B that I rescued off fleabay years ago.
They all march steadily along with each other.
Is there any use in doing a 10, 20, etc., 70V exercise with them?
I could run four 3458s and chart the readings at different voltages? 
 

Offline e61_philTopic starter

  • Frequent Contributor
  • **
  • Posts: 962
  • Country: de
Re: DMM linearity comparison
« Reply #64 on: November 16, 2018, 08:08:36 am »
Here is Python app used to log data from both meters and control W4808 calibrator.
You can see there I take 15 readings:

for ix in range (0,15): #take more samples

 and then use last 5 readings median (median = np.median(array[5:])) as final data on each step.

Ah, sorry. I thought you only take one measurement.

I did it like this to wait until the readings are stable:

Code: [Select]
    data = []
    while True:
        data.append( float( hp3458A.read() ) )
        if len(data) > 4 and ( (max(data[-5:]) - min(data[-5:]) ) < 500e-9):
            break

    meas = np.mean(data[-5:])

Surely, there is a shorter way to write this in python. And 500nV isn't applicable on all ranges.
 

Offline Kleinstein

  • Super Contributor
  • ***
  • Posts: 14192
  • Country: de
Re: DMM linearity comparison
« Reply #65 on: November 16, 2018, 09:13:08 am »
The median is usually the method of choice if there are some possibly outliers. With more normal noise the average is usually be better choice to get low noise data.  However the difference is not that large.

5 points are a little on the short side, but otherwise it could be interesting to also get an idea about the noise. At least with shorter integration one could use something like 10-20 conversions at 20 PLC and than calculate the average and std-deviation.

Waiting for 5 points within 500 nV is a little tricky, as this might take very long, possibly forever if too noisy and it is still not very sensitive to residual settling / drift. If settling is a problem it would be more about looking for the slope (e.g. linear regression slope, which is not that complicated or slow) is below a certain limit. To avoid very long waiting, one could allow the limit to go up with time - so more noisy data would take longer, but not for ever.
 

Offline e61_philTopic starter

  • Frequent Contributor
  • **
  • Posts: 962
  • Country: de
Re: DMM linearity comparison
« Reply #66 on: November 16, 2018, 02:33:02 pm »
I used it not to average the noise. It was used to wait for stabilization. One have to experiment a little bit with the limit. 500nV was working quite good in the 10V range with my SR1010-1k measurements.

I haven't tried a linear regression yet, but I don't think it will fit the e-function very well in this case. But one can try it :)
 

Offline Kleinstein

  • Super Contributor
  • ***
  • Posts: 14192
  • Country: de
Re: DMM linearity comparison
« Reply #67 on: November 16, 2018, 05:20:11 pm »
The linear regression does not need to fit a e function. It is more like an estimator for the slope, using more of the points.  It would not work for the initial phase, when there is possible ringing. So it might take both a small maximum difference and small slope.

Normally I would mainly rely on a delay, and the signal stability only as an additional check.
 

Offline e61_philTopic starter

  • Frequent Contributor
  • **
  • Posts: 962
  • Country: de
Re: DMM linearity comparison
« Reply #68 on: November 16, 2018, 05:46:19 pm »
For a measurement with fixed connectors a constant delay might be ok.
My experience with hand plugged things (did some linearity tests with a SR1010-1k some time ago) is, that it take very different times to settle. Even if you try to touch it very little and short. Sometimes it settles within the first 5 measurements to 500nVpp and sometimes after 20 measurements.

Which/how many points do you want to use to derive the slope?
« Last Edit: November 16, 2018, 05:49:04 pm by e61_phil »
 
The following users thanked this post: Electro Fan

Offline Kleinstein

  • Super Contributor
  • ***
  • Posts: 14192
  • Country: de
Re: DMM linearity comparison
« Reply #69 on: November 16, 2018, 06:24:57 pm »
For the slope I would use the same number of points as the real measurement, maybe leave out some of the later ones if the interval is really long. So 5-10 points look reasonable - with 10 points one could also calculate a reasonable standard deviation.
 

Offline Pipelie

  • Regular Contributor
  • *
  • Posts: 172
  • Country: cn
Re: DMM linearity comparison
« Reply #70 on: November 17, 2018, 07:15:25 pm »
just attach some data for comparison. :popcorn:

and attach the raw data as well.

D4000 vs 3458 INL of 10V(-11V to 0V 0.1V step 100NPLC).png
D4000 vs 3458 INL of 10V(0.1V to 0V 11V step 100NPLC).png

those two plots and 3458A#_CMP are using the script from e61_phil with some modification(average of 10 reading), thanks sharing the script.    about 3 hours/run.
//////////////
5440B vs 3458A&D1281 INL of 10V(+-11V_0.1V step, 100NPLC_FAST OFF).png
and this plot are using the script from TiN, each data is average of 5 reading. about 10 hours/run :palm:


Offline Kleinstein

  • Super Contributor
  • ***
  • Posts: 14192
  • Country: de
Re: DMM linearity comparison
« Reply #71 on: November 17, 2018, 07:40:50 pm »
The error signal shows quite some correlation between the meters. This would suggest that the error is more due to the calibrator than the meters. With the script from e61_phil , there might be changes in the waiting time.
 

Offline e61_philTopic starter

  • Frequent Contributor
  • **
  • Posts: 962
  • Country: de
Re: DMM linearity comparison
« Reply #72 on: November 17, 2018, 08:00:13 pm »
The error signal shows quite some correlation between the meters. This would suggest that the error is more due to the calibrator than the meters. With the script from e61_phil , there might be changes in the waiting time.

Yes, the script waits until all measurements are within 1µV. Perhaps one can wait a fixed time and compare the results?

I don't know the 1281, but I assume it is as slow as the 8508A. If that is the case one could increase the NPLC of the 3458A to integrate as long as the 1281 (for the measurement with the 1281).
 

Offline Pipelie

  • Regular Contributor
  • *
  • Posts: 172
  • Country: cn
Re: DMM linearity comparison
« Reply #73 on: November 18, 2018, 03:12:29 am »
The error signal shows quite some correlation between the meters. This would suggest that the error is more due to the calibrator than the meters. With the script from e61_phil , there might be changes in the waiting time.

Yes, the script waits until all measurements are within 1µV. Perhaps one can wait a fixed time and compare the results?

I don't know the 1281, but I assume it is as slow as the 8508A. If that is the case one could increase the NPLC of the 3458A to integrate as long as the 1281 (for the measurement with the 1281).

yeah, the D1281 is as slow as the 8508A.

5440B vs 3458A&D1281 INL of 10V(+-11V_0.1V step, 100NPLC_FAST OFF).png
and this plot are using the script from TiN, each data is average of 5 reading. about 10 hours/run, soaping time is 10 seconds and then take five four reading, return the average of them.
« Last Edit: November 19, 2018, 01:53:09 am by Pipelie »
 

Offline TiN

  • Super Contributor
  • ***
  • Posts: 4543
  • Country: ua
    • xDevs.com
Re: DMM linearity comparison
« Reply #74 on: November 18, 2018, 10:33:20 am »
Just a note - 8508A on RESL8, FAST_OFF is much slower than 1281, equivalent to about NPLC1020.
YouTube | Metrology IRC Chat room | Let's share T&M documentation? Upload! No upload limits for firmwares, photos, files.
 
The following users thanked this post: e61_phil


Share me

Digg  Facebook  SlashDot  Delicious  Technorati  Twitter  Google  Yahoo
Smf