Here updated graph, completed two runs and start of 3rd (with bit slower ramp).
TCR Box, resistors, wiring or meters are not disturbed between runs, and no work was performed nearby.
AC is always off, so there is only natural convection around in the room. You can see that from BME280 sensor readings,
with ambient temperature in range from +26 to +27C, RH in range 53-58%.
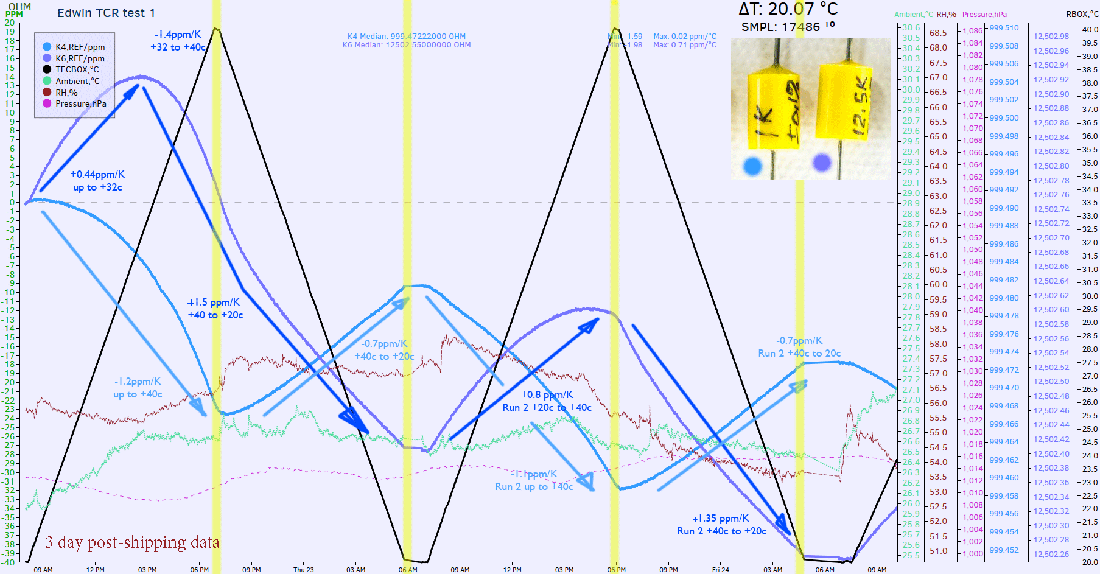
1K resistor behave normally and almost linear, other than about -10ppm shifts after each cycle.
However 12.5K one have positive tempco till around 32-35c, reversing to negative right after.
Resistance shift after first run was -27 ppm, and -13 after second run.
Make me think to bake these resistors for some good amount of hours and coat them afterwards to get more predictable behaviour.
Remember also that the 3458a isn't really the best way...
Indeed, even though actually pair of K2002's used for measurements above.
Just to note, most of foil resistor ramp up and ramp down linearly, and do not show resistance change after the shift (both hermetical fancy VHP's and regular S102's).
This can be also explained by much much smaller resistor element thermal mass in foil type resistors as well.
I would run the test again, but measure the performance at how these are actually used in your LTZ: Measure the ratio of output voltage 12.5k/1k
I think this is great summary of the next test, using my fresh acquired K6221.

Remember, it's going to take at least 100ppm change in heater resistor RATIO to change the Vref output of LTZ by 1ppm...
Great reminder to anyone playing with LTZ-REFs, I just mark this bold here for future lurkers. Indeed good point.

I would also suggest putting your resistors under bias for at least 24~48hrs before testing, especially after shipping. You don't know how cold or hot that shipping container got during transit - and any precision resistor will need some thermal stress recovery time under bias before you can measure true performance.
100% true.
Let's agree, that even with all going on these are great resistors, with very low tempco, suitable for usual LTZ1000 application, as there are no 20C variations in the circuit to even see any of these extreme resistance shifts. If one need
guaranteed better than 2ppm/K TCR resistor, get ready to pay something in XXX $USD range per piece and be ready to invest days of testing to confirm that number with proper gear.
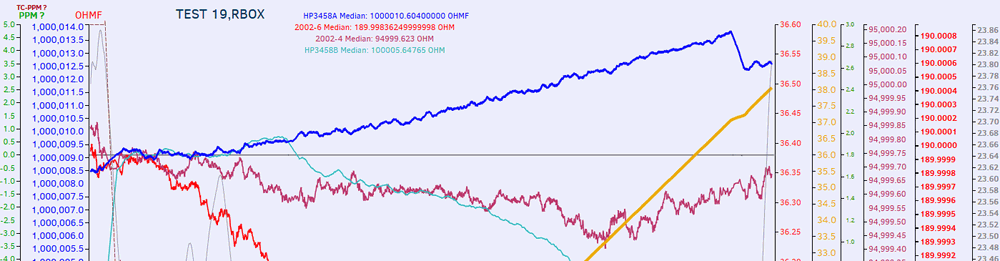
Here's a glimpse of one of my best resistors, measured by exactly same setup, 95 KOhm VHP101 with PMO. It was 90$ a pop and 30 weeks lead-time.


.


