Hello together,
for the first: you cannot compare different references like the REF5025 in SO-8 or MSOP-8 package
with a hermetically tight reference like the LT1236AILS8. They simply play in different worlds.
The REF5025 is a bandgap reference whereas the LT1236 is a buried zener device.
So the reference element behaves different. (also with respect to ageing).
Ok ageing does not only depend on the reference elemet. The output voltage resistor divider and package related stress to the die also play a role. The most stress to the package can be assumed by the soldering process during production of the board.
The common mode behavior on ageing curves of plastic packages I would blame on either humidity effects (swelling of the packages) or some other (mechanical) stress applied to all references on one pcb board.
The ageing with x ppm / sqrt(khr) I could measure up to now only on a hermetically tight buried zener device. And it seems to be from my measurements that it is also only valid for large ageing drift values. Below a certain drift limit my measurements show more or less a "random walk" which seem to consist of some seasonal effects over one year and in my measurements additional thermal gradient effects of the ADC reference + perhaps some hysteresis effects.
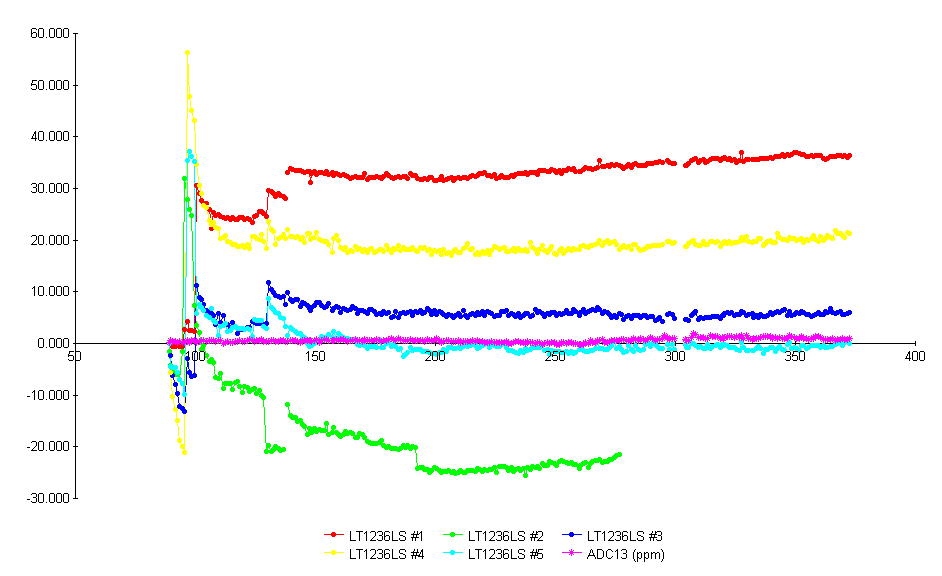
Attached some measurement data of 5 LT1236AILS8-5 buried zener references.
First I have to explain what happens.
I have several references running 24/7 within a thermal box. Each day the pcb is heated from around 35-40 °C (self heating temperature of the references at 20-25 degrees room temperature) to 50 +/- 0.2 degrees. After heating up all Gnd-Pins of the references are measured with my best ADC (there is a up to 60uV shift between them due to the supply currents) and after this all output pins are measured and the difference between output and gnd pin is recorded and the drift is calculated.
The ADC#13 which is used together with a 2:1 LTC1043 based voltage divider finally measures his own offset and a high stable LTZ1000 reference. And also this drift value is recorded on the sheet. So if you would want to exclude the drift of the adc and the voltage divider you would have to subtract the pink ADC13 curve from the reference curves.
Measurement starts at DAY89 when I put the 5 references into the temperature box.
Reference #1 had already 2 temperature cycles from around 10 - 45 °C for TC measurement at this day. So #1 was already running for 1 week.
For the other references I did the TC measurements after DAY89. Which can be seen as "shift" in their ageing curve.
As I mentioned relatively large hysteresis shifts I tried if they could be removed by some "thermal handling" so at day 100 I put all 5 references into the freezer (-18 °C) and warmed them up with a hair dryer several times. At day 130 I repeated thermal handling with #1-#4 and #5 had its TC measurement. Some TC measurements where repeated. Last one was on #2 at day 137. Except on day 192 where I repeated TC measurement for reference #2.
So "shi(f)t" happens as you can see on every "event" in life of the references. Every event starts a new ageing cycle. Either with a lower or a higher drift rate. The large drift rates after the events can be approximated by some sqrt-function. Whereas the final drifts after some thousand hours seem to drift randomly. (or perhaps my measurement system is not good engough).
The 2nd picture shows the same beginning from day 138 (approximately after 1200 hours from the begin).

Compared to other devices the LT1236 have larger hysteresis so it would be better not to heat them up every day but leave them at constant temperature. But since I'm still looking for the perfect non heated reference for battery supply with minimum power requirements I will not change my measurement conditions.
With best regards
Andreas


