2nd PDVS2mini v2 Tempco measurementI did a second tempco measurement, using the experience gained from the first. (But unfortunately before Ians ideas for improvement)
Now the PDVS2mini v2 was powered externally, so no battery problems. The PDVS2mini was switched on the evening before, so the batteries were fully charged, and extra warmth of the charging was gone long before the measurement started.
This time the temperature changes were even slower, so the PDVS2mini internal temperature could track the ambient better. And at the top and bottom temperatures I let the temperature dwell extra long, until PDVS2mini int. temp and output were stable too.
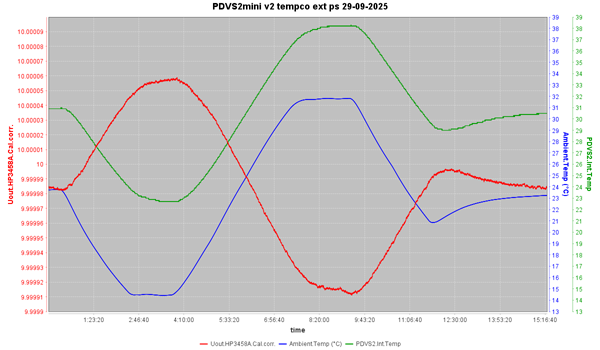
Full size graph:
PDVS2mini-v2-tempco-ext-ps-29-09-2025-1200pix.pngBlue trace is the ambient temperature. After letting everything stable for 30 minutes, the temperature goes slowly down in 2hours to 14.5°C. There it dwells for 1:20hour, until PDVS2mini internal temp and output are stable too.
Then the temperature rises slowly, in 4hours to the maximum temp of 31.7°C. There it dwells again for 1:30hours, again until PDVS2mini internal temp and output are stable too.
Then in 2hours back to the starting temperature. Unfortunately there was some overshoot. So, with power from the Peltier removed, I let it dwell towards an end temperature, with everything stable.
Green is the PDVS2mini v2 internal temperature. It is lagging the ambient temp. One can see where the ambient temp is constant, that the internal temp needs about an hour to really catch up.
And red is the output voltage of the PDVS2mini v2. As measured with the 3458A, and corrected with the calibration offset. Again one vertical division is 10uV = 1ppm.
The same measurement in Excel:
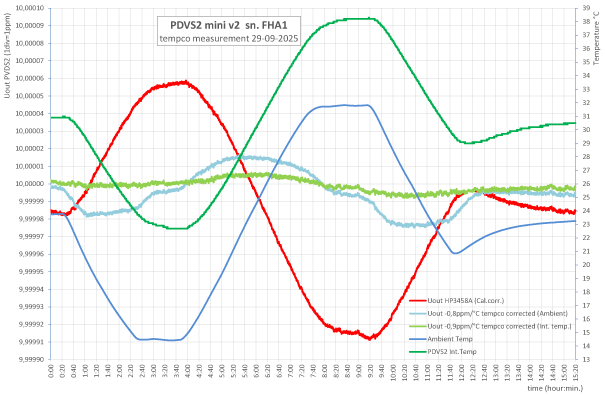
Full size graph:
PDVS2mini-v2-tempco-ext-ps-29-09-2025-Excel-1500pix.pngI used the Excel table to calculate the boxed method tempco. Points were chosen near the end of the dwell periods, where all temps and output were stable.
The result was
a box method tempco of -0,83ppm/°C related to the ambient temperature. Related to the PDVS2mini internal temperature, I got a tempco of -0,94ppm/°C
These values are close to the ones found in the first measurement.
Also in the Excel graph are the additional traces with the tempco calculated out
The light-blue trace is where the Ambient tempco was calculated out of the output voltage. Best result I got with a nominal temp of 22°C, and a tempco of -0,8ppm/°C
The light-green trace is where the tempco referenced to the PDVS2mini v2 internal temperature was calculated out. Here the best result I got with a nominal temp of 29°C, and a tempco of -0,9ppm/°C. This got me a very flat line (<±1ppm deviation, and very close to the nominal 10V output.
These tempco values are close to the boxed method values.
Another look at the tempco is plotting the PDVS2mini output against temperature. This is for the tempco referenced to the ambient temperature:
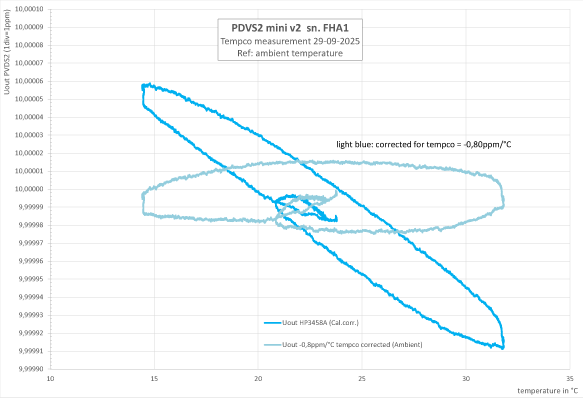
Full size graph:
PDVS2mini-v2-tempco-ext-ps-29-09-2025-Ambient-1500pix.pngBlue is the PDVS2 mini v2 output plotted against ambient temperature. Ideal would be a straight line. If tempco would be zero, a horizontal line. If the tempco would be non-linear, the line would not be straight (but a curve, or even more complex)
Here we see clearly that the output voltage is lagging the ambient temperature: it is shown by the distance between the the ascending and descending lines in the graph.
A good thing is that the beginning and ending are meeting: there is no long term hysteresis (a more permanent shift in output after the temperature changes)
Light-blue is the same plot, but with the tempco calculated out of it. This should be as horizontal as possible. I use this to judge if my tempco calculation was correct.
Here is the same graph, but this time the tempco referenced to the PDVS2mini internal temperature:
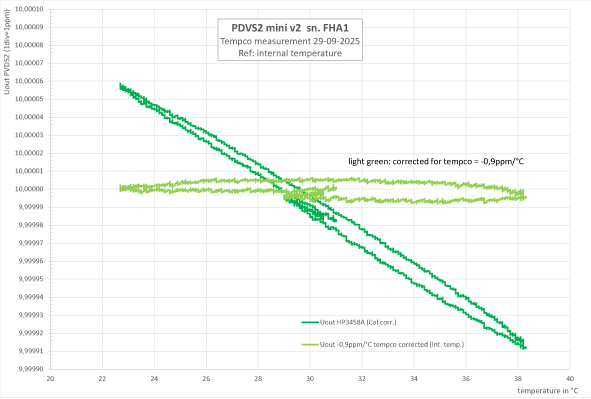
Full size graph:
PDVS2mini-v2-tempco-ext-ps-29-09-2025-Internal-1500pix.pngImmediately we see that the ascending and descending lines are now much closer: Less hysteresis, the coupling between the internal temp and output voltage is much better.
The line is straight: only first order tempco. Good!
Beginning and end of the line are close together: no long term term hysteresis. Also good!
The light-green line, with the tempco related to the internal temp calculated out of it, is more like a horizontal line. Showing that the tempco calculation was correct.
ConclusionsWithout the pressure of battery time, I was able to do a slower temp sweep. With longer dwell times resulting in a more reliable boxed method tempco calculation.
Starting and stopping at the same temp made (the absence of) long term hysteresis visible.
The found tempco figures maching pretty good with the results of the first measurement, strengthening confidence.
But the last graph, showing the tempco referenced to internal temperature is in my view the most important one.
It shows clearly that, although the existing tempco is higher then expected, it is linear (first order), and good coupling between temperature and output.
This means that the tempco could be calculated out of the output by the PDVS2 mini v2 firmware. It would result in a big improvement: in a 15°C temperature range output deviation would decrease from about 12ppm to 1...2ppm. Meaning the last digit becomes a lot less temperature dependent, and thus more reliable.
The PDVS2mini v2 is a good and useful reference as it is. I am happy with it. But it seems there is room for further improvement. If I were the designer, I would be very tempted to further improve an already very good device...
regards, Gertjan.

 Home
 Help
 Search
 Login
 Register


