Author Topic: An advanced question - sampling an oscillator's signal for analysis  (Read 55550 times)

0 Members and 1 Guest are viewing this topic.

Offline thermistor-guy

  • Frequent Contributor
  • **
  • Posts: 372
  • Country: au
Re: An advanced question - sampling an oscillator's signal for analysis
« Reply #150 on: June 25, 2018, 02:41:41 am »
...
TVAR is just MVAR scaled with the averaging-time (usually 'tau'), and thus TDEV has units of time (seconds). It predicts how much variance in phase (in units of time) to expect (in an RMS-sense) from one phase point to the next (where the spacing between points is tau).
In practice there are technical problems with measuring a (gap-free!) frequency time-series and then predicting (integrating) phase from that - not recommended. For timekeeping measure phase with a time-interval counter.

which is consistent with the Wikipedia article, in the section on Time Stability estimators:
https://en.wikipedia.org/wiki/Allan_variance

I found the Research History  section also informative:

Quote
...The classical M-sample variance of frequency was analysed by David Allan[3] along with an initial bias function. That article tackles the issues of dead-time between measurements and analyses the case of M frequency samples (called N in the article) and variance estimators...

As a time-nut novice, I'd say this is not an easy article, and not an easy topic.
 

Offline tomato

  • Regular Contributor
  • *
  • Posts: 206
  • Country: us
Re: An advanced question - sampling an oscillator's signal for analysis
« Reply #151 on: June 25, 2018, 02:45:16 am »

maybe the wikipedia use of 'movement' is not the best here - I don't think any deterministic movement should be understood.
In the example if you take a time-series of frequency-points, each averaged for 1s, and histogram the difference between consecutive points, you should get some (not necessarily known..) distribution with a width of 1.3e-9 in relative units (13 mHz if the time-series in in Hz).

The parenthetical remark was probably missed by most, but it is very important.
 

Offline tomato

  • Regular Contributor
  • *
  • Posts: 206
  • Country: us
Re: An advanced question - sampling an oscillator's signal for analysis
« Reply #152 on: June 25, 2018, 03:53:22 am »

Consider the situation in Figure 1. Each period produces a result - either G or L. These results are analyzed over the averaging interval. If the probabilithy of obtaining G is p, then the probability of obtaining a L is 1-p. For simplicity it is assumed that p=1-p=.5.

For measuring oscillator stability the statistic of interest is not how many Gs or Ls appear in an averaging interval, but the difference between these values. The process represented by an averaging interval is well-known and is called a bernoulli trial. The expected value of the difference between the number of Gs and Ls is presented here, specifically: 2mp - m = m(2p-1) = 0. [Note: the referenced web page uses n as the number of trials, whereas here that value is m. The value n is used here to represent the number of averaging intervals. Also, the problem solved there is stated in terms of successes and failures. The logic is exactly the same. Simply substitute L for success and G for failure.]

The variance of the difference between the two random variables in a Bernoulli trial (see above reference) is: 4mp2 = m. Notice (!) that the variance depends on m. So, as the value of tau increases, so does the variance.

Your picture of an oscillator has evolved from a Gaussian distribution (in earlier posts) to a binomial distribution, but the distribution for any real oscillator is not purely one or the other.  Oscillator noise is complicated -- it cannot (generally) be reduced to a simple Gaussian process with it's "jitter" described by a single parameter, i.e. by a standard deviation.

Quote
Given the capabilities of computers in the 1960s and 1970s, when Allan Variance was developed, it was necessary to increase tau in order to obtain long-term measures of clock stability. Today, computers are much more powerful. So, it would be interesting to determine the sample_time/tau ratio above which an analyst would be forced to increase tau in order to obtain practical clock evaluation results. This would, of course, depend on the computer available. However, I would guess most desktop systems these days could analyze a very long data set in a practical amount of time.

Allan Variance calculations are very simple calculations.  They do not require much computational power, even when measuring long term stability. Tau is often increased for long term measurements because there are hardware advantages (reduced dead time, higher counter resolution, etc.) and it is computationally convenient to simply increase tau instead of increasing the number of data points. There are no serious disadvantages to increasing tau instead of increasing the number of data points.

An example: Let's say you want to measure the Allan Variance from tau = 1 s to tau = 105 s. To get a reliable Allan Variance at 105 s, you will need 106 s of data.

Method 1) Collect 106 counter readings with a gate time of 1 s. Total number of data points is 106, and the total acquisition time is about 278 hours.

Method 2) Collect 103 counter readings with a gate time of 1 s, then collect 104 counter readings with a gate time of 100 s. The total number of data points is about 100x less than method 1, the dead time is about 100x less than method 1, counter resolution is improved, but the total acquisition time is only about 17 minutes longer. Resulting Allan Variance will be consistent with that attained by method 1.
 

Offline dnessettTopic starter

  • Regular Contributor
  • *
  • Posts: 242
  • Country: us
Re: An advanced question - sampling an oscillator's signal for analysis
« Reply #153 on: June 27, 2018, 01:04:12 am »
OK, I tried to sharpen the result given in my recent post on the variance of average clock (not oscillator) frequency over an interval tau (i.e., that it increases with increasing tau). But, the result I now have suggests just the opposite - variance should decrease with increasing tau. Here is the argument.

The oscillator model presented in most of the papers I have read about Allan Variance proposes that at each time t the oscillator signal has an associated instantaneous frequency, say if(t). The average frequency over the interval tau is then the intergral of if(t) over that interval. While conceptually clean, this model is not amenable to a simple mathematical treatment. In particular, it leads to the formulation of a generalized Wiener process with continuous time and continuous variable. Believe me, this is not something an amatuer wants to get anywhere near.

So, it is prudent to formulate a different oscillator model using some simplifying, but realistic assumptions. In particular, discard the idea of instantaneous frequency. Conceptually, one can observe the length of each period of the oscillator signal. This defines an average frequency over that period. The average frequency over a tau interval is then the average of these averages. Also, assume the average frequencies observed over each period are i.i.d. (see the material in this post. Also see the discussion below).

The advantage of this model is it is easy to analyze. The disadvantage is it presumes measurements begin and end at the same place in a period (e.g., at the rising edge). Since tau is measured using an ideal oscillator (or in a practical measurement setup, by a reference oscillator), it is virtually certain the beginning and end of the tau interval will not fall at the same place in the period of the oscillator implementing the clock under test. However, if the number of periods in the tau interval is very large, the errors introduced by this inaccuracy will be very small, so from a practical perspective, this is not an issue.

One problem with the model is the assumption that the period average distributions are i.i.d.  This implies the oscillator has no drift, which is not realistic. So, in order to apply this model, the collected data must be first analyzed using regression and any non-random effects removed.

Given this background, the confusing result is immediate. The tau interval frequency is the sum of the average period frequencies divided by the number of periods (m, where tau = m * oscillator period length). The central limit theorem (see Central Limit Theorem) stipulates that the average of the sum of any set of i.i.d. random variables, independent of their underlying probability distribution, converges to a random variable with a normal distribution with mean mu (the expected value of each period distribution) and variance sigma2/m (where sigma2 is the variance of the period distribution). Consequently, the tau interval frequency should decrease with increasing tau, since when tau increases, so does m.

Can anyone figure out where have I gone wrong? Might it be that I have assumed non-random effects are first removed before analyzing the data? If so, then Allan Variance has little attraction, since regression analysis has improved considerably since the 1960s and 1970s. The sample time average is the average of the tau averages, so the central limit theorem applies to the sample average as well. One could utilize the 3 sigma rule on the standard variance of the sample time distribution to compute a probability bounds on clock jitter.

Added 6-28-18: I figured out my mistake. By modeling the oscillator as a signal source with a RV per period that when sampled specifies its length, I decreased tau to equal one oscillator period. Thus, there is no accumulation of period length errors, which is why variance increases with increasing tau in the traditional model.
« Last Edit: June 28, 2018, 11:55:53 pm by dnessett »
 

Online rhb

  • Super Contributor
  • ***
  • Posts: 3483
  • Country: us
Re: An advanced question - sampling an oscillator's signal for analysis
« Reply #154 on: June 27, 2018, 01:50:16 am »
Quote
  In particular, it leads to the formulation of a generalized Wiener process with continuous time and continuous variable. Believe me, this is not something an amateur wants to get anywhere near.

I don't think it's all that bad, but then I've been doing it for 30 years.  But, yes, they had good reason to call the classified version of "Extrapolation, Interpolation and Smoothing of Stationary Time Series" the "yellow peril" in reference to the yellow covers indicating a classified document.

I'll comment further later, but I did an interesting experiment today.  Using a Rohde & Schwarz RTM3104 I measured the period of my GPSDO at an output frequency of 10 MHz.  I also measured the output of my 33622A at 10 MHz.  I don't know the jitter spec for Leo Bodnar's dual output GPSDO, but Keysight claims less than 1 pS for the 33622A and less than 0.5 pS with the OXCO option which I don't think I have.   The statistics function of the RTM3K gave a standard deviation of ~26 pS for both sources.  At present I have to attribute that to the RTM3K time base.

The RTM3K provides a 10 MHz reference out which I'll analyze when I get my SDRplay RSP2 working again with the GPSDO reference input.  Right now it's not getting along with Windows 7 on a VBox VM.


Offline dnessettTopic starter

  • Regular Contributor
  • *
  • Posts: 242
  • Country: us
Re: An advanced question - sampling an oscillator's signal for analysis
« Reply #155 on: June 27, 2018, 03:00:19 am »
Quote
  In particular, it leads to the formulation of a generalized Wiener process with continuous time and continuous variable. Believe me, this is not something an amateur wants to get anywhere near.

I don't think it's all that bad, but then I've been doing it for 30 years.  But, yes, they had good reason to call the classified version of "Extrapolation, Interpolation and Smoothing of Stationary Time Series" the "yellow peril" in reference to the yellow covers indicating a classified document.

Here is my logic. Modeling a process that changes at every value of t, where t is a subset of the real line, requires continuous time. The change at each value of t is not discrete, but rather a sample from the Real line, which (I am less sure about this) requires a continuous random variable for each value t. From what I have read so far, normal weiner processes do not support random variables that produce results from the reals, for that you need a generalized wiener process.

I'll comment further later, but I did an interesting experiment today.  Using a Rohde & Schwarz RTM3104 I measured the period of my GPSDO at an output frequency of 10 MHz.  I also measured the output of my 33622A at 10 MHz.  I don't know the jitter spec for Leo Bodnar's dual output GPSDO, but Keysight claims less than 1 pS for the 33622A and less than 0.5 pS with the OXCO option which I don't think I have.   The statistics function of the RTM3K gave a standard deviation of ~26 pS for both sources.  At present I have to attribute that to the RTM3K time base.

I agree. The culprit is probably the RTM3K time base.
 

Offline tomato

  • Regular Contributor
  • *
  • Posts: 206
  • Country: us
Re: An advanced question - sampling an oscillator's signal for analysis
« Reply #156 on: June 27, 2018, 03:43:52 am »
Given this background, the confusing result is immediate. The tau interval frequency is the sum of the average period frequencies divided by the number of periods (m, where tau = m * oscillator period length). The central limit theorem (see Central Limit Theorem) stipulates that the average of the sum of any set of i.i.d. random variables, independent of their underlying probability distribution, converges to a random variable with a normal distribution with mean mu (the expected value of each period distribution) and variance sigma2/m (where sigma2 is the variance of the period distribution). Consequently, the tau interval frequency should decrease with increasing tau, since when tau increases, so does m.

You're making this far too complicated.  Forget about making m measurements of the oscillator period and the Central Limit Theorem -- it's a red herring. Consider the simple case of frequency measurements of duration (gate time) equal to tau = m * period.  If you take N frequency measurements and plot the distribution, what will you see?  For any real oscillator, the distribution of frequency values will not, in general, be Gaussian and the standard deviation may not be independent of the number of samples, N.  In fact, the distribution can take different forms depending on the value of tau and/or the number of samples, N.  This arises because there can be several physical processes driving the instability of the oscillator, and these processes can have very different signatures.  Some will dominate at short times, while others may dominate at long times.  Some can actually produce a nice Gaussian distribution of frequency values but, generally, only for a certain range of tau values.

Quote
Can anyone figure out where have I gone wrong? Might it be that I have assumed non-random effects are first removed before analyzing the data? If so, then Allan Variance has little attraction, since regression analysis has improved considerably since the 1960s and 1970s. The sample time average is the average of the tau averages, so the central limit theorem applies to the sample average as well. One could utilize the 3 sigma rule on the standard variance of the sample time distribution to compute a probability bounds on clock jitter.

You seem to have concluded long ago that the Allan Variance has no practical value, and keep trying to find ways to support your conclusion. It is an extremely powerful tool.  Ignoring it is your loss.
 

Online rhb

  • Super Contributor
  • ***
  • Posts: 3483
  • Country: us
Re: An advanced question - sampling an oscillator's signal for analysis
« Reply #157 on: June 27, 2018, 01:00:17 pm »
I'm attaching a relevant section from:

Probability, Random Variables and Stochastic Processes
A. Papoulis
McGraw-Hill 1965

This is by far the best reference I have on probability theory.  While not a complete treatment of the oscillator noise problem, it does cover several important cases and provides exact results.

I'll have a look later at some other references, but this what I usually start with.  However, I have many books for the sole reason that they treat some particular case which no one else does.

I should have mentioned earlier that if you have a DSO, you can collect simultaneous traces from as many oscillators as you have inputs and then run cross spectral analyses.  If one of those is a GPSDO, you should get splendid results.  B & P should provide sufficient details.  You'll need to handle ADC channel skew and various other sampling artifacts bit it's pretty straight forward stuff.
« Last Edit: June 27, 2018, 01:44:15 pm by rhb »
 

Offline dnessettTopic starter

  • Regular Contributor
  • *
  • Posts: 242
  • Country: us
Re: An advanced question - sampling an oscillator's signal for analysis
« Reply #158 on: July 03, 2018, 01:15:43 am »
I finally got my GPSDO working and ran a test on my Rubidium oscillator. I used the GPSDO as the reference clock and (among other things) measured how long it took the Rubidium to slip a period (it was loosing time). It took about 52 minutes. This means it slips ~1.15 cycles per hour or ~27.7 cycles per day. At 100 ns per cycle, this means it is slipping 2.77 msec per day (27.7 cycles*(100 ns/cycle)). Comparing that to the FEI FE-5650 spec of 2*10e-11/day for drift, my oscillator is over 1000 times worse. For example, see this list where it also specifies a drift figure of 2*10e-11/day and equates this to gaining/losing +/- 1.1 usec per day.

Now I realize this measured drift occurred over only 1 hour and the Rubidium oscillator might gain back some time over a full day. However, I periodically looked at my scope over a period of 3 hours and it always appeared that the Rubidium was loosing time. Also, it is possible that some of this error is attributable to the GPSDO, but I imagine not much of it.

The vendor who sold me the Rubidium oscillator provided a data sheet. If I am reading it correctly, the oscillator was built in Nov, 2003 - which means it is ~15 years old. I couldn't find any aging data in the spec, so I don't know if such a degradation of performance is within the unit's specs.

Of course, it is possible that my result arises from an operator error. I didn't sit at the scope looking at the drift for 52 minutes. It is possible the drift reversed while I was out of the room and I read a cycle shift when in fact the drift reversed and no slippage occurred. I would be interested whether any one else has tested an old ebay Rubidium oscillator for drift to see if my result is typical.
 

Offline tautech

  • Super Contributor
  • ***
  • Posts: 28382
  • Country: nz
  • Taupaki Technologies Ltd. Siglent Distributor NZ.
    • Taupaki Technologies Ltd.
Re: An advanced question - sampling an oscillator's signal for analysis
« Reply #159 on: July 03, 2018, 01:43:51 am »
Could the quality/strength of the GPSDO reception be causing this ?
Avid Rabid Hobbyist
Siglent Youtube channel: https://www.youtube.com/@SiglentVideo/videos
 

Offline thermistor-guy

  • Frequent Contributor
  • **
  • Posts: 372
  • Country: au
Re: An advanced question - sampling an oscillator's signal for analysis
« Reply #160 on: July 03, 2018, 03:14:51 am »
.. This means it slips ~1.15 cycles per hour or ~27.7 cycles per day. At 100 ns per cycle, this means it is slipping 2.77 msec per day (27.7 cycles*(100 ns/cycle)). Comparing that to the FEI FE-5650 spec of 2*10e-11/day for drift, my oscillator is over 1000 times worse. For example, see this list where it also specifies a drift figure of 2*10e-11/day and equates this to gaining/losing +/- 1.1 usec per day.
...
27.7 * 100E-9 s per day = 2.77E-6 s per day

relative error = 2.77E-6 s per day / 8.64E4 s per day = 0.32 * 1E-6 * 1E-4 = 3.2E-11

So your Rubidium reference is a little out of spec., but not way out. May I suggest leaving it powered, uninterrupted, for a week, and checking the drift once per day. You might find it comes back into spec.  The good news is that the servo loop that drives the Rb resonance cell seems to be working.

Usually, Rb references come with a C-field adjustment that you can fine-tune, once you are satisfied the drift rate is stable. See for example the C-field section in:

http://www.wriley.com/Rubidium%20Frequency%20Standard%20Primer%20102211.pdf
 
The following users thanked this post: dnessett

Offline dnessettTopic starter

  • Regular Contributor
  • *
  • Posts: 242
  • Country: us
Re: An advanced question - sampling an oscillator's signal for analysis
« Reply #161 on: July 03, 2018, 05:26:03 am »

27.7 * 100E-9 s per day = 2.77E-6 s per day

relative error = 2.77E-6 s per day / 8.64E4 s per day = 0.32 * 1E-6 * 1E-4 = 3.2E-11

So your Rubidium reference is a little out of spec., but not way out. May I suggest leaving it powered, uninterrupted, for a week, and checking the drift once per day. You might find it comes back into spec.  The good news is that the servo loop that drives the Rb resonance cell seems to be working.

I didn't realize the drift figure was relative error. Thanks.

However, that gives rise to another mystery. How is it that the list I quoted specifies 2*10e-11/day relative accuracy, but the time accuracy figure is 1.1 usec/day?


Usually, Rb references come with a C-field adjustment that you can fine-tune, once you are satisfied the drift rate is stable. See for example the C-field section in:

http://www.wriley.com/Rubidium%20Frequency%20Standard%20Primer%20102211.pdf

Thanks for the reference. It is very helpful.
 

Offline dnessettTopic starter

  • Regular Contributor
  • *
  • Posts: 242
  • Country: us
Re: An advanced question - sampling an oscillator's signal for analysis
« Reply #162 on: July 03, 2018, 05:27:53 am »
Could the quality/strength of the GPSDO reception be causing this ?

The GPSDO indicates both a lock with the GPS satellites and error less than 0.1Hz. So, I think the reception is OK.
 

Offline tautech

  • Super Contributor
  • ***
  • Posts: 28382
  • Country: nz
  • Taupaki Technologies Ltd. Siglent Distributor NZ.
    • Taupaki Technologies Ltd.
Re: An advanced question - sampling an oscillator's signal for analysis
« Reply #163 on: July 04, 2018, 10:26:40 am »
Avid Rabid Hobbyist
Siglent Youtube channel: https://www.youtube.com/@SiglentVideo/videos
 

Offline dnessettTopic starter

  • Regular Contributor
  • *
  • Posts: 242
  • Country: us
Re: An advanced question - sampling an oscillator's signal for analysis
« Reply #164 on: July 07, 2018, 01:04:59 am »
I ran a test that recorded the phase difference between my Rubidium oscillator (FEI FE-5650A) and a cheap GPSDO I bought on ebay, which is described in the discussion within this thread. Internally, it is identical to the unit shown here. The phase difference data described below was collected after both the Rubidium oscillator achieved Lock and the GPSDO showed satellite acquistion and oscillator integrity whereby the accumulated frequency error was less than 100 mHz (the latter condition occurs when the ALM LED goes off, see the ebay listing). After that condition arose, I waited an extra hour for complete oscillator warm-up before viewing signals and collecting data. For the purposes of this micro-study, I assumed the GPSDO was the reference clock and the Rubidium oscillator was the DUT. To minimize noise in the scope probe measurements, I didn't use the normal ground wire configuration. Instead, I used the spring on the probe tip technique, which meant the distance between the probe tip and grounding site was on the order of a few mm.

I obtained the phase difference data using an ebay board hosting an AD8302 chip (data sheet here). Characteristics of this chip important to this discussion are: 1) it provides both an amplitude and phase difference signal. The phase difference signal is free from oscillator AM modulation noise.

The AD8302 phase difference signal encodes the phase difference as a voltage, where the phase difference runs from 0 - 180 degrees (180 - 360 degrees is mapped onto that interval with decreasing increasing voltage). 180 degrees of separation is represented by 30 mV; 90 degrees of separation is represented by 900 mV; and 0 degrees of separation is represented by 1.8V. Therefore, 10 mV excursion represents 1 degree of change. There are dead zones near 180 and 0 degrees.

The AD8302 uses a multiplier circuit to detect phase changes. It turns out that when comparing 2 10MHz signals, the sum of these frequencies leaks through (i.e., there is a 20MHz component). The AD8302 provides for lowering the output bandwidth by adding an external capacitor. For the tests described below, I used a 68pf capacitor, which is insufficient to suppress all of the 20 MHz (and, it turns out 40 MHz) signal.

Figure 1 shows the spectral power density of the phase difference signal from 1 - 100 MHz.

Figure 1 -

Figure 2 shows the spectral power density from 9 KHz-1 MHz. As is evident, most of the spectral power density exists between 0 Hz and 400 KHz. The power below 9 KHz is not analyzable by my SA (a SIGLENT SSA3021X).

Figure 2 -

Figure 3 shows the oscilloscope display (Rigol DS 1104Z) of a typical phase difference signal.

Figure 3 -

Figure 4 shows a zoomed-in display of the 20 MHz signal modulated on the phase difference signal.

Figure 4 -

I ran a one-shot capture of the phase difference signal and moved it to a USB stick. Important parameters for the data series are: 500 Msa/s and 6 Mpoints captured - implying 2 ns between each data point and a 12 msec (2ns * 6E6) capture period. After importing the data into Octave, I ran a 5th order Butterworth 10 MHz low pass software filter on it to eliminate the 20 MHz modulation. Figure 5 shows 100,000 points of the filtered data (in black) superimposed over the unfiltered data (in yellow).

Figure 5 -

The data set exported by the Rigol has two columns: 1) the index of the row (i.e., 0, 1, 2, 3, ....) and the voltage for that data point. I converted the index column into a time value by multiplying it by 2*10e-9 and converted the voltage value to radians by multiplying each value by ((2*pi)/360)/.01. Figure 6 shows the resulting data set.

Figure 6 -

Corrected Figure 6, which didn't have full x-axis label.

It is apparent from this figure that the data set contains significant white noise. I used the dftmag2 Octave (and MATLAB) function described in the (excellent) article Real spectrum analysis with Octave and MATLAB to create a spectral density plot of the software filtered phase difference data. This function eliminates the DC (first bin) and last bin values, since (as explained in the article) they must be normalized differently than the other data and there is no normalization procedure that works well. Figure 7 shows the result (using a loglog plot).

Figure 7 -

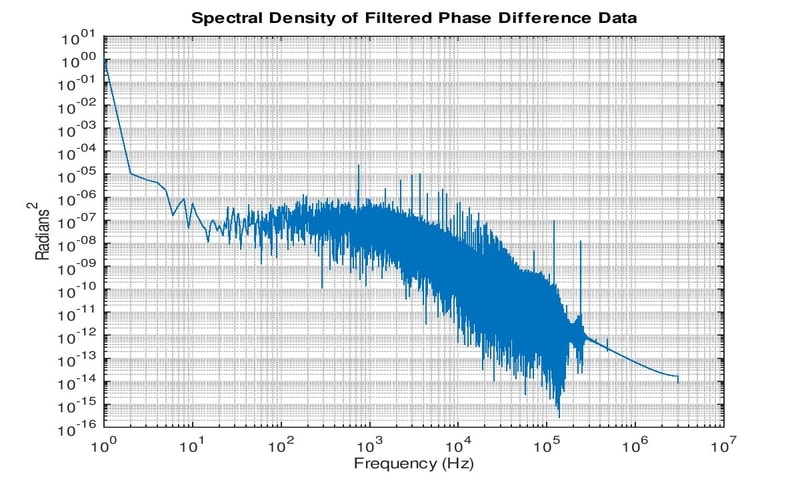
Several features are notable. First, comparing the plot with Figure d on pg. 75 of the report Handbook of Frequency Analysis by W. J. Riley, it appears that the signal is composed of white noise at frequencies greater than 1000 Hz. However, between 10Hz and 1000Hz, the loglog plot has an average slope of zero. From 1Hz to 10 Hz the slope is very steep. I am insufficiently schooled in phase fluctuation analysis to interpret the last two characteristics.

There is one other interesting result. I wanted some sense of the variation of phase differences over the 12 msec interval. The max and min of the raw data are 0.74100 and 0.55700 respectively. Converting this to degrees (which are easier to visualize than radians) yields 74.1 and 55.7, which is a difference of 18.4 degrees. This is an enormous variation of phase between the DUT and Reference Clock for such a short interval of time, which took me by complete surprise. This may indicate a problem with my test setup or may suggest that the very short-term stability of the Rubidium and GPSDO oscillators are horrible. Recall that both utilize a crystal oscillator in a frequency locked loop. It may be that the feedback loop frequency is significantly greater than 12 msec, which allows the crystal oscillator to display significant jitter during short intervals. However, this result completely mystifies me.

I am new to oscillator evaluation and freely acknowledge that my test setup and analysis may have significant flaws. I welcome any constructive criticism that others might give. I also have made the data I collected available for others to inspect or analyze. The zipped cvs file is available here. At the beginning of the file is a Creative Commons Share-alike/Attribution license as well as some comments, which means effectively you can do anything you want with it. Each line of text has the "%" character in the first position, so the file can be loaded by Octave or MATLAB without change. For other analysis engines, it is up to the user to convert the file to the appropriate format.
« Last Edit: July 07, 2018, 05:33:17 am by dnessett »
 

Offline tomato

  • Regular Contributor
  • *
  • Posts: 206
  • Country: us
Re: An advanced question - sampling an oscillator's signal for analysis
« Reply #165 on: July 07, 2018, 02:13:11 am »
There's a host of simple sanity checks you can should do. The first is to connect one oscillator to both inputs, with one arm delayed by a long (20-50 ft.) piece of coax.
 
The following users thanked this post: dnessett

Offline dnessettTopic starter

  • Regular Contributor
  • *
  • Posts: 242
  • Country: us
Re: An advanced question - sampling an oscillator's signal for analysis
« Reply #166 on: July 07, 2018, 02:44:15 am »
There's a host of simple sanity checks you can should do. The first is to connect one oscillator to both inputs, with one arm delayed by a long (20-50 ft.) piece of coax.

Good thought. Anything else?
 

Offline tomato

  • Regular Contributor
  • *
  • Posts: 206
  • Country: us
Re: An advanced question - sampling an oscillator's signal for analysis
« Reply #167 on: July 07, 2018, 03:31:36 am »
Good thought. Anything else?

Step 2 depends on the results of step 1, and digesting the results of step 1 could take longer than you think.
 

Offline dnessettTopic starter

  • Regular Contributor
  • *
  • Posts: 242
  • Country: us
Re: An advanced question - sampling an oscillator's signal for analysis
« Reply #168 on: July 07, 2018, 11:34:43 pm »
There's a host of simple sanity checks you can should do. The first is to connect one oscillator to both inputs, with one arm delayed by a long (20-50 ft.) piece of coax.

The only long piece of coax I have lying around is ~83 feet. Since it is RG-58 (which has a delay characteristic of 1.541 ns/foot), this will push the delayed signal into the next period (I have measured signal peak to delayed signal peak delay of 29.2 ns, which implies 129.2 ns). Is there any reason why this will not work?
 

Offline dnessettTopic starter

  • Regular Contributor
  • *
  • Posts: 242
  • Country: us
Re: An advanced question - sampling an oscillator's signal for analysis
« Reply #169 on: July 08, 2018, 10:34:55 pm »
There's a host of simple sanity checks you can should do. The first is to connect one oscillator to both inputs, with one arm delayed by a long (20-50 ft.) piece of coax.

Following this suggestion, I performed the indicated delay check on both the Rubidium and GSPDO oscillators. Instead of using a 20-50 foot coax, I used an 83 foot RG-58 coax I had lying around. The delay for this coax (using the established signal delay for RG-58 of 1.541 ns/foot) is ~ 128 ns. When I eye-balled the cursors to the peaks of the signal and its delayed twin, I measured 29.2 ns. So, the delayed signal slipped a period and represented 129.2 ns of delay.

I won't show the plots, since they look pretty much like the noise plot previously posted. However, here are the max/min values for each experiment:

GPSDO delayed: max=0.90900;min=0.49300
Rubidium delayed: max=0.85600;min=0.68400

In degrees this represents a difference of:

GPSDO delayed: 41.6 degrees
Rubidium delayed: 17.2 degrees

Both of these seem to be very large for the 12 msec measurement period, as was the case for the GPSDO/Rubidium phase difference measurement.

To see if there was a problem with the AD8302 or its setup, I used a dataset that I had previously captured comprising the simultaneous values for the GPSDO and Rubidium oscillators displayed on the Rigol scope. This data set has only 3 Mpts, representing 6 msec of capture, since my Rigol only has 12 Mpts of storage and I was probing the phase difference signal at the same time as the two input signals.

Once I loaded the data set into an Octave variable "randg"", I performed the following software analysis (see this discussion/first answer/section on Hilbert Transform):

Code: [Select]
r=randg(:,2);
g=randg(:,3);
r_h=hilbert(r);
g_h=hilbert(g);
phase_rad = angle(r_h ./ g_h);

The Hilbert transform enables access to the phase data associated with the two signals. The variable "phase_rad" is the software equivalent of the AD8302 phase difference signal. The max and min of phase_rad were (in radians):

max=2.3345
min=1.8933

Converting to degrees (i.e., multiplying by 360/(2*PI)=57.3), yields:

max=133.7
min=108.5

Which represents a phase difference interval of 25.2 degrees.

This suggests that the AD8302 is not causing the high variation of phase differences during the interval.

So, either the signals are displaying these large values of phase fluctuation, or there is something wrong with the Rigol or its setup.

In order to investigate the latter possibility, I used a TEK 2465 scope to display the GPSDO delayed phase difference signal from the AD8302. Figure 1 shows the result.

Figure 1 -

The phase difference signal is at the top with the input and delayed signals at the bottom. I used a probe set to 1X to measure the phase difference signal and the cursors show the extent of the voltage excursion visible on the scope. While the cursor readout indicates 1.6V, the cursor logic assumes the use of a 10X probe, so in fact the voltage variation is 160mV. This represents 16 degrees of variation. While this is significantly less than the 41.6 degrees obtained from the Rigol data, that is most probably due to the max and min of the phase difference data not occuring often enough to display on the 2465.

At this point, I am beginning to believe the large phase difference result as an actual phenomenon, rather than a measurement blunder. However, I am not confident of this conclusion and think it is now time to ask others (in the spirit of scientific enquiry) who have a Rubidium oscillator or GPSDO oscillator (of the same kind I have) if they would run tests on their units to see if they confirm or repudiate these results. It is unnecessary to use an AD8302 in this process. Any method that indicates the phase differences of a delayed GPSDO, delayed Rubidium or Rubidium versus a GPSDO would suffice.
« Last Edit: July 08, 2018, 10:54:10 pm by dnessett »
 

Offline tomato

  • Regular Contributor
  • *
  • Posts: 206
  • Country: us
Re: An advanced question - sampling an oscillator's signal for analysis
« Reply #170 on: July 09, 2018, 03:06:35 am »

Following this suggestion, I performed the indicated delay check on both the Rubidium and GSPDO oscillators. Instead of using a 20-50 foot coax, I used an 83 foot RG-58 coax I had lying around. The delay for this coax (using the established signal delay for RG-58 of 1.541 ns/foot) is ~ 128 ns. When I eye-balled the cursors to the peaks of the signal and its delayed twin, I measured 29.2 ns. So, the delayed signal slipped a period and represented 129.2 ns of delay...

Here's the sanity check: You are seeing phase measurements that range from 16 degrees to 41 degrees, when you measure from one cycle of an oscillator to the next cycle ... does that seem reasonable? 

If you really want to make this unambiguous, cut your cable down to 20' and repeat the measurement.

Quote
At this point, I am beginning to believe the large phase difference result as an actual phenomenon, rather than a measurement blunder. However, I am not confident of this conclusion and think it is now time to ask others (in the spirit of scientific enquiry) who have a Rubidium oscillator or GPSDO oscillator (of the same kind I have) if they would run tests on their units to see if they confirm or repudiate these results. It is unnecessary to use an AD8302 in this process. Any method that indicates the phase differences of a delayed GPSDO, delayed Rubidium or Rubidium versus a GPSDO would suffice.

I did a quick measurement (with a long cable delay in one arm) using a time interval counter.  I could see 0.01 deg variations using a good oscillator, which is likely limited by the 4ps resolution of the counter. A lower quality oscillator gave variations of about 0.1 deg. The only way I could get the variations to approach 1 deg was by attenuating the oscillator amplitude, thereby decreasing the rise time and introducing discriminator errors.


Offline dnessettTopic starter

  • Regular Contributor
  • *
  • Posts: 242
  • Country: us
Re: An advanced question - sampling an oscillator's signal for analysis
« Reply #171 on: July 09, 2018, 04:29:54 am »
Here's the sanity check: You are seeing phase measurements that range from 16 degrees to 41 degrees, when you measure from one cycle of an oscillator to the next cycle ... does that seem reasonable? 

If you really want to make this unambiguous, cut your cable down to 20' and repeat the measurement.

I do not understand your point. What do you mean by "when you measure from one cycle of an oscillator to the next cycle"? The total variation is observed over 120,000 cycles. I specifically asked you whether delaying by more than one period would be important. You did not answer. If you think this is an important point, would you answer it now and explain why it is important?

Also, the total variation is not a per period statistic. It represents the maximum phase difference minus the minimum phase difference over the whole interval of 120,000 cycles. For example, taking the GPSDO delayed case, one period during the interval had a phase shift of 90.9 degrees, while another, probably distant from the first period, had a phase shift of 49.3 degrees. It is extremely unlikely that the change from maximum to minimum phase shift occurred over a single period.

Nevertheless, I agree the result is counterintuitive and am open to an alternative explanation that identifies how these measurements arise?

I did a quick measurement (with a long cable delay in one arm) using a time interval counter.  I could see 0.01 deg variations using a good oscillator, which is likely limited by the 4ps resolution of the counter. A lower quality oscillator gave variations of about 0.1 deg. The only way I could get the variations to approach 1 deg was by attenuating the oscillator amplitude, thereby decreasing the rise time and introducing discriminator errors.

Would you identify the oscillators you tested? My observations were for specific oscillator types (specifically, a cheap eBay GPSDO and a FEI FE-5650A Rubidium oscillator). I am not claiming the results apply to all oscillators.

But more importantly, I don't understand your test set-up. Would you elaborate? Does your statistic of 0.1 degree variation represent the maximum phase fluctuation over a large number of cycles?

Updated later, since I inadvertantly pressed "Post" before finishing the response.
 

Offline dnessettTopic starter

  • Regular Contributor
  • *
  • Posts: 242
  • Country: us
Re: An advanced question - sampling an oscillator's signal for analysis
« Reply #172 on: July 09, 2018, 04:44:40 am »
I did a quick measurement (with a long cable delay in one arm) using a time interval counter.  I could see 0.01 deg variations using a good oscillator, which is likely limited by the 4ps resolution of the counter. A lower quality oscillator gave variations of about 0.1 deg. The only way I could get the variations to approach 1 deg was by attenuating the oscillator amplitude, thereby decreasing the rise time and introducing discriminator errors.

Thinking about this, it is possible there is non-random drift in the data. If you observed 0.1 degree variation between consecutive periods, then if this was completely non-deterministic drift in one direction, over 120,000 cycles, the phase difference would have changed by 12,000 degrees (obviously, this is an extreme example, which I make only to suggest how your results and mine might be harmonized). I will look to see if there are any non-deterministic factors in the data.

But, even if there are, the changes I reported seem large considering the measurement interval was only 12 msec long. If these results stand-up, I would say using either of these oscillators as the distribution signal to synchronize instruments in a lab would be problematic for most (or at lease many) tests.
 

Offline tomato

  • Regular Contributor
  • *
  • Posts: 206
  • Country: us
Re: An advanced question - sampling an oscillator's signal for analysis
« Reply #173 on: July 09, 2018, 05:00:01 am »
I do not understand your point. What do you mean by "when you measure from one cycle of an oscillator to the next cycle"? The total variation is observed over 120,000 cycles.

What does the output of your AD chip represent?  It represents the relative phase of the two inputs right now.  It doesn't know anything about the phase of the signal 120,000 cycles later.

Quote
I specifically asked you whether delaying by more than one period would be important. You did not answer. If you think this is an important point, would you answer it now and explain why it is important?

You made your measurement with the longer cable without waiting for an answer.  There's nothing wrong with that, so I tried to apply a sanity test to what you observed.

Quote
Also, the total variation is not a per period statistic. It represents the maximum phase difference minus the minimum phase difference over the whole interval of 120,000 cycles. For example, taking the GPSDO delayed case, one period during the interval had a phase shift of 90.9 degrees, while another, probably distant from the first period, had a phase shift of 49.3 degrees. It is extremely unlikely that the change from maximum to minimum phase shift occurred over a single period.

Both the 90.9 deg phase shift and the 49.3 deg phase shift represent the time delay that occurs from the start of one oscillator cycle to the start of the next cycle. The only way to get that big of a (real) change is if the frequency of the oscillator changed by about 1 MHz.

The whole point of this test is to remove phase fluctuations of the oscillator from the problem.  Cut your cable down to 20' and see what you get.  Any "phase fluctuations" you measure will be due to your acquisition system, not the oscillator.

Quote
Would you identify the oscillators you tested? My observations were for specific oscillator types (specifically, a cheap eBay GPSDO and a FEI FE-5650A Rubidium oscillator). I am not claiming the results apply to all oscillators.

I used a couple of Stanford Research clock generators (CG635). One has a Rb timebase, the other has a standard time base, but the oscillator doesn't really matter if you use a shorter cable for the measurement.

The issue is not whether the results apply to other oscillators; the issue is whether the results are reasonable.

Quote
But more importantly, I don't understand your test set-up. Would you elaborate? Does your statistic of 0.1 degree variation represent the maximum phase fluctuation over a large number of cycles?

Each measurement is the the relative phase of the oscillator and the oscillator delayed by roughly 1-1/2 cycles.  The time interval counter can do some simply statistics on the measurements, nothing fancy.


Offline tomato

  • Regular Contributor
  • *
  • Posts: 206
  • Country: us
Re: An advanced question - sampling an oscillator's signal for analysis
« Reply #174 on: July 09, 2018, 05:03:14 am »

Thinking about this, it is possible there is non-random drift in the data. If you observed 0.1 degree variation between consecutive periods, then if this was completely non-deterministic drift in one direction, over 120,000 cycles, the phase difference would have changed by 12,000 degrees (obviously, this is an extreme example, which I make only to suggest how your results and mine might be harmonized). I will look to see if there are any non-deterministic factors in the data.

But, even if there are, the changes I reported seem large considering the measurement interval was only 12 msec long. If these results stand-up, I would say using either of these oscillators as the distribution signal to synchronize instruments in a lab would be problematic for most (or at lease many) tests.

Cut your cable. It's easy and it will remove any issues about the stability of your oscillator and instantly tell you if your acquisition system is measuring anything real.


Share me

Digg  Facebook  SlashDot  Delicious  Technorati  Twitter  Google  Yahoo
Smf