Author Topic: Cube IDE / 32F4 breakpoints and "dynamic printf", etc  (Read 1994 times)

0 Members and 1 Guest are viewing this topic.

Offline peter-hTopic starter

  • Super Contributor
  • ***
  • Posts: 3694
  • Country: gb
  • Doing electronics since the 1960s...
Cube IDE / 32F4 breakpoints and "dynamic printf", etc
« on: April 18, 2021, 09:20:25 am »
Does anyone know how to use this feature


I have googled around and it may be that some specific code has to be inserted into the project, i.e. this is not a special type of breakpoint which allows you to printf some variables to some window in Cube IDE. But I am not at all sure... everything I found online seems a mess.

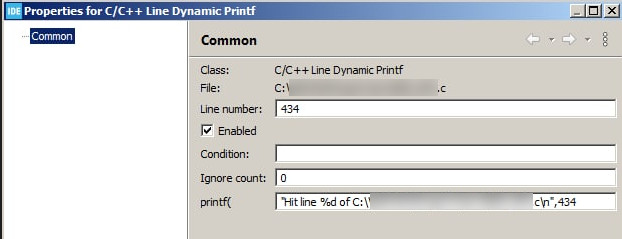
I have set up this dynamic printf and I see a load on debugger activity in the Console window, but no data comes out anywhere obvious.

More basically, I am looking for a way to set up a breakpoint so that it doesn't stop the program but increments a counter. Obviously, the program will be interrupted for some time (does anyone know how long?).

I have noticed there is an ignore count on a breakpoint and perhaps there is some way to monitor that, if it decrements. That must also pause the program, for however long the debugging system takes to process it. Do different debuggers affect this pause? I am using  ST-LINK V2 ISOL.

I have also noticed ST-LINK V3 has a VCP (on an extra connector) so if one of the UARTs is wired to these pins, you could run Teraterm on the PC to receive any debugs sent to that UART. But that requires target code, obviously, and my target has a USB port already with a VCP on it so we can send printfs to that.


« Last Edit: April 18, 2021, 09:26:09 am by peter-h »
Z80 Z180 Z280 Z8 S8 8031 8051 H8/300 H8/500 80x86 90S1200 32F417
 

Online DavidAlfa

  • Super Contributor
  • ***
  • Posts: 5895
  • Country: es
Re: Cube IDE / 32F4 breakpoints and "dynamic printf", etc
« Reply #1 on: April 18, 2021, 11:45:51 am »
You need to send the printf output somehow.
To see it within the debugger you can use swv console, you need to write a _write function that sends the data.
https://embeddedarea.com/stm32-debugging-with-printf-by-using-swv-or-openocd/

It would be the same method to send it through a serial port:
https://community.st.com/s/question/0D50X0000B8kTytSQE/printf-not-working-write-never-gets-called
« Last Edit: April 18, 2021, 11:48:08 am by DavidAlfa »
Hantek DSO2x1x            Drive        FAQ          DON'T BUY HANTEK! (Aka HALF-MADE)
Stm32 Soldering FW      Forum      Github      Donate
 

Offline peter-hTopic starter

  • Super Contributor
  • ***
  • Posts: 3694
  • Country: gb
  • Doing electronics since the 1960s...
Re: Cube IDE / 32F4 breakpoints and "dynamic printf", etc
« Reply #2 on: April 18, 2021, 10:05:38 pm »
OK; I had the impression this feature implemented a printf type debug output, to some window in the Cube IDE environment.

I am now looking for a way to set up a breakpoint so that it doesn't stop the program but increments a counter. Obviously, the program will be interrupted for some time (does anyone know how long?).
Z80 Z180 Z280 Z8 S8 8031 8051 H8/300 H8/500 80x86 90S1200 32F417
 

Offline bugnate

  • Regular Contributor
  • *
  • Posts: 58
  • Country: us
Re: Cube IDE / 32F4 breakpoints and "dynamic printf", etc
« Reply #3 on: April 19, 2021, 03:26:25 am »
OK; I had the impression this feature implemented a printf type debug output, to some window in the Cube IDE environment.

I am now looking for a way to set up a breakpoint so that it doesn't stop the program but increments a counter. Obviously, the program will be interrupted for some time (does anyone know how long?).

This?
https://sourceware.org/gdb/current/onlinedocs/gdb/Break-Commands.html
 
The following users thanked this post: techman-001

Offline peter-hTopic starter

  • Super Contributor
  • ***
  • Posts: 3694
  • Country: gb
  • Doing electronics since the 1960s...
Re: Cube IDE / 32F4 breakpoints and "dynamic printf", etc
« Reply #4 on: April 19, 2021, 06:21:50 am »
That seems to be some sort of command line mode. I am using Cube IDE.

However, this
https://sourceware.org/gdb/current/onlinedocs/gdb/Dynamic-Printf.html#Dynamic-Printf
suggests that the dynamic printf does indeed do what I thought it did. And yes the output does end up in the "debugger console" window. So that's solved!

This is a really brilliant feature!

However, I have seen a comment that the execution time is quite long. I may do a setup where two pulses are generated, before and after, and measure it with a scope. Is this feature implemented wholly in the debugger, or does the data travel all the way to the PC via USB, and the printf is implemented on that? I think it must be, since the debugger is a small ARM and an FPGA, and it doesn't appear to be running on the target.
« Last Edit: April 19, 2021, 09:41:59 am by peter-h »
Z80 Z180 Z280 Z8 S8 8031 8051 H8/300 H8/500 80x86 90S1200 32F417
 

Offline bugnate

  • Regular Contributor
  • *
  • Posts: 58
  • Country: us
Re: Cube IDE / 32F4 breakpoints and "dynamic printf", etc
« Reply #5 on: April 19, 2021, 04:53:10 pm »
Is this feature implemented wholly in the debugger, or does the data travel all the way to the PC via USB, and the printf is implemented on that? I think it must be, since the debugger is a small ARM and an FPGA, and it doesn't appear to be running on the target.

If by debugger you mean the ST-LINK V3, I would assume the latter. You'd be paying a lot more for something like the former.

Note the "dprintf-style" parameter. I don't know what you already tried, but my reading is that this setting would determine if the printf (or whatever) is executed locally ("call") on the µC or handled on the PC. The former should be faster, but I'd expect both options to be relatively slow (milliseconds, at least) because either way GDB is coordinating things remotely from the PC which is just inherently slow, as you have noted.
 

Offline peter-hTopic starter

  • Super Contributor
  • ***
  • Posts: 3694
  • Country: gb
  • Doing electronics since the 1960s...
Re: Cube IDE / 32F4 breakpoints and "dynamic printf", etc
« Reply #6 on: April 19, 2021, 05:27:10 pm »
I have found yet another way to send debugs: the SWO one-wire debug interface. This is one of the Jtag pins. The debugs come out in the SWV ITM data console in Cube IDE. This is supposed to be fairly fast, since it runs at 2mbps. You have to do something in main.c to connect printf() to this one-wire interface, and it does work.


It is under Run / Debug Configurations / Debugger


I will have a go at timing this to see how much time it steals from the target.

I can see the output (the window in Cube IDE) is not very fast; I reckon it could not display data at a few kbytes/sec. It also usually drops the first byte of the first message. But so long as it runs fast at the target end, that's ok.
« Last Edit: April 19, 2021, 05:47:10 pm by peter-h »
Z80 Z180 Z280 Z8 S8 8031 8051 H8/300 H8/500 80x86 90S1200 32F417
 

Offline peter-hTopic starter

  • Super Contributor
  • ***
  • Posts: 3694
  • Country: gb
  • Doing electronics since the 1960s...
Re: Cube IDE / 32F4 breakpoints and "dynamic printf", etc
« Reply #7 on: April 19, 2021, 08:07:54 pm »
Some updates on debug timing. I did a printf("1234567890") and timed the gap with a scope between two pulses generated before and after.

SWO debug / SWV ITM data console: 6-20us
Dynamic Printf / debugger console: 120ms

A slight difference :)


Z80 Z180 Z280 Z8 S8 8031 8051 H8/300 H8/500 80x86 90S1200 32F417


Share me

Digg  Facebook  SlashDot  Delicious  Technorati  Twitter  Google  Yahoo
Smf