Author Topic: Heap analysis tool for embedded systems  (Read 2809 times)

0 Members and 1 Guest are viewing this topic.

Offline peter-hTopic starter

  • Super Contributor
  • ***
  • Posts: 3697
  • Country: gb
  • Doing electronics since the 1960s...
Heap analysis tool for embedded systems
« on: August 14, 2022, 12:00:14 pm »
Some context is here
https://www.eevblog.com/forum/programming/best-thread-safe-printf-and-why-does-printf-need-the-heap-for-f-etc/

There are tools out there but mostly irrelevant stuff for Java etc.

It seems obvious that any such tool must be totally specific to the heap code you are using. My project uses a heap which came in the ST Cube supplied libc.a library (no source provided).

When I do a malloc I get the address of the allocated block (or NULL) which is a kind of handle to the block, but to work back to where the calling code is, you would need to capture the address of the code calling malloc() and them somehow work back through the symbol table, to produce a list of C functions and how much heap each one owns.

Or one could step through the heap and compile a list of allocated blocks but without knowing who has which one.

Where does heap code store the list of blocks? Does it malloc that as well? :)

Z80 Z180 Z280 Z8 S8 8031 8051 H8/300 H8/500 80x86 90S1200 32F417
 

Offline SiliconWizard

  • Super Contributor
  • ***
  • Posts: 14476
  • Country: fr
Re: Heap analysis tool for embedded systems
« Reply #1 on: August 14, 2022, 06:27:14 pm »
The easiest approach for heap allocation analysis is to wrap heap management functions (malloc, calloc, free...) in custom functions (usually by defining macros that will override them) than can trace heap use in the manner that is most relevant for you. It's not hard to do. But there are ready-made solutions for this (such as Valgrind) - thing is, most of them are not very lightweight or may need a hosted environment, so they aren't ideal for MCUs. But rolling your own according to your own needs is not rocket science and would be a nice addition to your toolset.

That can be implemented in, for instance, a single header file that you'd include *after* any standard header.
The idea would look like:
Code: [Select]
#ifdef HEAP_TRACE

#undef malloc
#define malloc(size)    myTraceMalloc(size, __LINE__, __FILE__)

(...)

static inline void * myTraceMalloc(size_t size, int line, const char *fileName)
{
(...)
}

(...)

#endif
 
The following users thanked this post: peter-h

Online eutectique

  • Frequent Contributor
  • **
  • Posts: 391
  • Country: be
Re: Heap analysis tool for embedded systems
« Reply #2 on: August 15, 2022, 07:48:50 pm »
You might want to try Fortify library by Simon Bullen. It is doing exactly what SiliconWizard suggested, but has rather little overhead. One of the places to get it: https://ftp.fau.de/aminet/dev/c/fortify22.lha

As I can see, the version there is from 1995. I've got a version from 2008, attached.
 
The following users thanked this post: edavid, peter-h, mwb1100

Online eutectique

  • Frequent Contributor
  • **
  • Posts: 391
  • Country: be
Re: Heap analysis tool for embedded systems
« Reply #3 on: August 15, 2022, 07:56:42 pm »
Googled a bit more, the only place with the latest version of Fortify is http://svn.netlabs.org/repos/fm2/trunk/dll
 
The following users thanked this post: peter-h, mwb1100

Offline Sherlock Holmes

  • Frequent Contributor
  • **
  • !
  • Posts: 570
  • Country: us
Re: Heap analysis tool for embedded systems
« Reply #4 on: December 03, 2022, 08:18:28 pm »
Some context is here
https://www.eevblog.com/forum/programming/best-thread-safe-printf-and-why-does-printf-need-the-heap-for-f-etc/

There are tools out there but mostly irrelevant stuff for Java etc.

It seems obvious that any such tool must be totally specific to the heap code you are using. My project uses a heap which came in the ST Cube supplied libc.a library (no source provided).

When I do a malloc I get the address of the allocated block (or NULL) which is a kind of handle to the block, but to work back to where the calling code is, you would need to capture the address of the code calling malloc() and them somehow work back through the symbol table, to produce a list of C functions and how much heap each one owns.

Or one could step through the heap and compile a list of allocated blocks but without knowing who has which one.

Where does heap code store the list of blocks? Does it malloc that as well? :)

I designed and wrote a concurrent and persistent heap manager some years back, for Windows. One could persist the heap as a disk image file (and thus restore complex state from that image). Anyway that has a diagnostic system built in as part of the design. One could have the heap automatically run a validation of all metadata before each allocate and before each free, yes it would crawl when one did that but it would almost always discover corruption and get one quite close to the cause.

I don't really know the algorithms used by C and I guess they are not part of the standard, so how to validate a C heap is an interesting question.

There was also a tagging option, one could pass a simply 4 char tag code into the allocate calls, that would let you track back which bit of code allocated which blocks, this was done in functional areas not with ever tag being different (i.e. you might have tags like 'INTH' for interrupt handlers or 'IOBF' for code that allocates buffer for IO and so on.

The tagging can be done easily by you too, you just allocate a special struct on top of what the "user" wants to allocate. But though this is useful the real culprits of heap corruption is code over writing metadata or other already allocated user data.

Sometimes one can test a system with randomized inputs and let it run, doing a validation call on ever allocate/free, if you can generate a repeatable failure (that is, use repeatable random values) like that you're well on the way to fixing it.
“When you have eliminated all which is impossible, then whatever remains, however improbable, must be the truth.” ~ Arthur Conan Doyle, The Case-Book of Sherlock Holmes
 

Offline peter-hTopic starter

  • Super Contributor
  • ***
  • Posts: 3697
  • Country: gb
  • Doing electronics since the 1960s...
Re: Heap analysis tool for embedded systems
« Reply #5 on: December 04, 2022, 10:59:39 am »
Has anyone done a heap analysis tool for the GCC Newlib heap code?

This is what comes in ST Cube IDE, but without sources. Somebody did find the sources somewhere; on github I believe.
Z80 Z180 Z280 Z8 S8 8031 8051 H8/300 H8/500 80x86 90S1200 32F417
 

Online eutectique

  • Frequent Contributor
  • **
  • Posts: 391
  • Country: be
Re: Heap analysis tool for embedded systems
« Reply #6 on: December 04, 2022, 06:25:52 pm »
This is what comes in ST Cube IDE, but without sources. Somebody did find the sources somewhere; on github I believe.

You can get the source tarball for older (before v11) versions of ARM tools from the ARM website. For example, gcc-arm-none-eabi-9-2020-q2-update-src.tar.bz2 contains the following:

Code: [Select]
> ll gcc-arm-none-eabi-9-2020-q2-update/src/
total 186M
-rw-r--r--  1   39M May 21  2020 binutils.tar.bz2
-rw-rw-r--  1  275K May 27  2020 build-manual.tar.bz2
-rw-r--r--  1  396K May 21  2020 expat-2.1.1.tar.bz2
-rw-r--r--  1   86M May 21  2020 gcc.tar.bz2
-rw-r--r--  1   37M May 21  2020 gdb.tar.bz2
-rw-r--r--  1  2.3M May 21  2020 gmp-6.1.0.tar.bz2
-rw-r--r--  1  2.8K May 21  2020 installation.tar.bz2
-rw-r--r--  1  1.5M May 21  2020 isl-0.18.tar.xz
-rw-r--r--  1  146K May 21  2020 libelf-0.8.13.tar.gz
-rw-r--r--  1  5.1M May 21  2020 libiconv-1.15.tar.gz
-rw-r--r--  1  655K May 21  2020 mpc-1.0.3.tar.gz
-rw-r--r--  1  1.3M May 21  2020 mpfr-3.1.4.tar.bz2
-rw-r--r--  1   14M May 21  2020 newlib.tar.bz2
-rw-r--r--  1  9.2K May 21  2020 samples.tar.bz2
-rw-r--r--  1  558K May 21  2020 zlib-1.2.8.tar.gz

newlib.tar.bz2 is what you are after.

Check the version of your compiler
Code: [Select]
> arm-none-eabi-gcc --version
arm-none-eabi-gcc (GNU Arm Embedded Toolchain 9-2020-q2-update) 9.3.1 20200408 (release)
and choose the (closest) archive to download.
 

Offline peter-hTopic starter

  • Super Contributor
  • ***
  • Posts: 3697
  • Country: gb
  • Doing electronics since the 1960s...
Re: Heap analysis tool for embedded systems
« Reply #7 on: December 04, 2022, 07:47:21 pm »
I am confused. This is what I get from --version

arm-none-eabi-gcc (GNU Tools for STM32 10.3-2021.10.20211105-1100) 10.3.1 20210824 (release)

However, I have frozen libc.a from GCC tools v9 (probably v9), due to issues described e.g. here
https://www.eevblog.com/forum/programming/best-thread-safe-printf-and-why-does-printf-need-the-heap-for-f-etc/msg4325479/#msg4325479

There is a link there which purports to be right but it is just for the printf library
https://sourceware.org/git?p=newlib-cygwin.git;a=blob;f=newlib/libc/stdio/vfprintf.c;h=6a198e2c657e8cf44b720c8bec76b1121921a42d;hb=HEAD#l866
Stepping through the code (I spent many hours on that) suggests it is similar or identical to the above printf (in the way it uses the heap, and the duff calls to mutexes in an attempt to make it thread-safe).

I cannot recall if my frozen libc.a contains the heap code. I think it does, but that lib is dated 1990 so I doubt the heap code changed from GCC v9 to GCC v10 :)

I also found this in my notes from when I was doing this a year ago:
Other Newlib sources can be found here
https://developer.arm.com/downloads/-/arm-gnu-toolchain-downloads
which is what you are saying above.

But where is the malloc() and free() source code?

Anyway I would not have the skills to write a heap analyser even if I had the source code for malloc(). I was hoping somebody has done it, in the 32 years since :)
Z80 Z180 Z280 Z8 S8 8031 8051 H8/300 H8/500 80x86 90S1200 32F417
 

Offline mwb1100

  • Frequent Contributor
  • **
  • Posts: 529
  • Country: us
Re: Heap analysis tool for embedded systems
« Reply #8 on: December 04, 2022, 08:33:02 pm »
You might want to look at dmalloc to see if it'll work for you:

  - https://dmalloc.com/

It's been a long while since I used it, but it's still being maintained. Some commits have been made within the last month.  However it looks like it's been a year since any code commits of much consequence - but it's been around for a while (the changelog goes back to 1993) so it's no surprise that it's quite mature.

It has great docs, but they are geared toward a Unix environment so if you're using Windows it might need some futzing around (I have found that the gnu utilities optionally installed with Git for Windows work pretty well - in particular I have been able to run many of my bash scripts on Windows with no changes, which was a great surprise).
 
The following users thanked this post: peter-h

Offline SiliconWizard

  • Super Contributor
  • ***
  • Posts: 14476
  • Country: fr
Re: Heap analysis tool for embedded systems
« Reply #9 on: December 04, 2022, 08:34:18 pm »
malloc() is in newlib. The official source code is there: ftp://sourceware.org/pub/newlib/
(unfortunately the offical source seems only downloadable through FTP. But there are some unofficial repos of newlib on github.)

Not sure what version of newlib your specific toolchain embeds, or how it is configured. But you can download the latest and look at the source code, malloc() probably hasn't changed much.

malloc()/free() can be found in the newlib/libc/stdlib/ subdirectory in malloc.c (which is essentially a placeholder) / mallocr.c (which contains the real code.)

In mallocr.c, malloc() is defined as the mALLOc() function and free() as fREe(). Yeah there's a mess of renaming and redefinitions.
It's a lot of code. Not sure what you'd like to do with it.
 
The following users thanked this post: peter-h

Online eutectique

  • Frequent Contributor
  • **
  • Posts: 391
  • Country: be
Re: Heap analysis tool for embedded systems
« Reply #10 on: December 04, 2022, 09:30:53 pm »
Anyway I would not have the skills to write a heap analyser even if I had the source code for malloc(). I was hoping somebody has done it, in the 32 years since :)

The Fortify library mentioned above does exactly this. It wraps maloc/calloc/realloc/strdup/free to track the call sites, with file names and line numbers, similar to assert(). It also adds canaries before and after allocated block, and fills the block on allocation and deallocation:
Code: [Select]
#define FORTIFY_BEFORE_SIZE      32  /* Bytes to allocate before block */
#define FORTIFY_BEFORE_VALUE   0xA3  /* Fill value before block        */

#define FORTIFY_AFTER_SIZE       32  /* Bytes to allocate after block  */
#define FORTIFY_AFTER_VALUE    0xA5  /* Fill value after block         */

#define FORTIFY_FILL_ON_ALLOCATE               /* Nuke out malloc'd memory       */
#define FORTIFY_FILL_ON_ALLOCATE_VALUE   0xA7  /* Value to initialize with       */

#define FORTIFY_FILL_ON_DEALLOCATE             /* free'd memory is cleared       */
#define FORTIFY_FILL_ON_DEALLOCATE_VALUE 0xA9  /* Value to de-initialize with    */

It can report all the allocated and deallocated blocks and call sites at any time.

Some other useful features include:
* set allocation limit -- an allocation fails (returns NULL) if the limit is exceeded
* set allocation fail rate in percent -- a random percentage of allocations fail

Two decades ago we used a modified version of Fortify where we can set the number of allocations to succeed. It was very useful for unit and module tests, which was part of CI -- a module is called time after time with incrementing number of successful allocations, starting from 0, until the module has done all necessary allocations. Each simulated fail must have been tackled by the module, otherwise cvs blame pointed the finger.

And you don't need the malloc() source code for this.
 
The following users thanked this post: peter-h

Offline peter-hTopic starter

  • Super Contributor
  • ***
  • Posts: 3697
  • Country: gb
  • Doing electronics since the 1960s...
Re: Heap analysis tool for embedded systems
« Reply #11 on: December 04, 2022, 09:49:03 pm »
Quote
And you don't need the malloc() source code for this.

OK, I get it.

I understood this a different way: the allocated blocks must be maintained as some sort of linked list and if you had the source code you could analyse that list and produce a map of blocks, potentially a real time updated one. I have a tool like that for the FreeRTOS stacks display, which is damn useful. But this method would not tell you which bit of your sourcecode owned which block. It would just indicate the state of the heap, and indicate fragmentation.

Putting hooks in the malloc/free calls tells you more, but does it tell you about the "condition" of the heap?
Z80 Z180 Z280 Z8 S8 8031 8051 H8/300 H8/500 80x86 90S1200 32F417
 

Online eutectique

  • Frequent Contributor
  • **
  • Posts: 391
  • Country: be
Re: Heap analysis tool for embedded systems
« Reply #12 on: December 04, 2022, 10:39:48 pm »
Putting hooks in the malloc/free calls tells you more, but does it tell you about the "condition" of the heap?

No, it does not tell anything about heap's internal condition. For that, you indeed should modify malloc and/or _sbrk.

BTW, _sbrk_r() is implemented in FreeRTOS/Source/portable/MemMang/heap_useNewlib_ST.c source file.
 

Offline SiliconWizard

  • Super Contributor
  • ***
  • Posts: 14476
  • Country: fr
Re: Heap analysis tool for embedded systems
« Reply #13 on: December 05, 2022, 02:24:55 am »
_sbrk() may be your best bet as I don't think you can override malloc() itself except in your own code through redefinitions as I showed earlier. But in existing library code (such as printf() and a number of others) that is already compiled, it will call whatever malloc() was compiled in, not your own version. OTOH, I think _sbrk() is a weak symbol so you can override it more easily without needing to recompile all standard libraries.
 

Offline peter-hTopic starter

  • Super Contributor
  • ***
  • Posts: 3697
  • Country: gb
  • Doing electronics since the 1960s...
Re: Heap analysis tool for embedded systems
« Reply #14 on: December 05, 2022, 08:05:44 am »
_sbrk I have; it had a stupid bug and I had to fix it.

However I don't see what _sbrk gives you; it just returns the last usable memory location

Code: [Select]

caddr_t _sbrk(int incr)
{
extern char end asm("end");
extern char top asm("_top");
static char *heap_end;
char *prev_heap_end;

// This test is never met since heap_end is never going to be = 0
// "end" = 0x2000edf8 (see linkfile)
if (heap_end == 0)
heap_end = &end;

prev_heap_end = heap_end;

// top = 2001e000 (top of 128k RAM minus 8k stack)
if (heap_end + incr > &top)
{
// write(1, "Heap and stack collision\n", 25);
// abort();
errno = ENOMEM;
return (caddr_t) -1;
}


heap_end += incr;

return (caddr_t) prev_heap_end;
}

However I can see _sbrk gets called whenever malloc gets called, so it can be a useful hook into malloc without having to modify malloc itself.

I have a new printf which doesn't use the heap. Heap usage for that sort of stuff is stupid IMHO. I know why it is done (previous threads to do with bignum based "perfect float" implementations) but it isn't needed in any real world embedded usage.

A graphical display of the heap blocks would be most useful because in an embedded system you tend to know what code is calling malloc. Fragmentation, or just running out, is a bigger problem. Well, the Newlib libc.a was a surprise, but I dealt with that by weakening the library (using objcopy) and replacing the printf family. I still have the heap code in there, so that could be replaced if needed. That heap code had another issue (it used mutexes, but the calls were dummy stubs, and I fixed those).
« Last Edit: December 05, 2022, 08:28:40 am by peter-h »
Z80 Z180 Z280 Z8 S8 8031 8051 H8/300 H8/500 80x86 90S1200 32F417
 

Offline Sherlock Holmes

  • Frequent Contributor
  • **
  • !
  • Posts: 570
  • Country: us
Re: Heap analysis tool for embedded systems
« Reply #15 on: December 05, 2022, 03:42:29 pm »
Quote
And you don't need the malloc() source code for this.

OK, I get it.

I understood this a different way: the allocated blocks must be maintained as some sort of linked list and if you had the source code you could analyse that list and produce a map of blocks, potentially a real time updated one. I have a tool like that for the FreeRTOS stacks display, which is damn useful. But this method would not tell you which bit of your sourcecode owned which block. It would just indicate the state of the heap, and indicate fragmentation.

Putting hooks in the malloc/free calls tells you more, but does it tell you about the "condition" of the heap?

Or multiple lists, some designs use multiple free lists demarcated by size of freed block.

When a block is freed the heap manager must consider if either or both physically adjacent blocks are free too. If either of them are, it must merge the block being freed with one or both of these and then determine whether that merged size means the "head" coalesced block should now be removed from the list and put onto a different one.

If a block being freed though is adjacent to the "virgin area" (as it's sometimes called) then no free lists might be involved, the virgin area pointer is just adjusted more or less, the amount of free space is increased and that's pretty much that.

Multiple free lists give you reduced average allocate time but at an increase in free time. In a design where we need to allocate very quickly this a good design, then one can do the free by queuing it perhaps or doing it at some later time when the system is idle.

I have no idea how C ordinarily structures the heap.

« Last Edit: December 05, 2022, 03:52:41 pm by Sherlock Holmes »
“When you have eliminated all which is impossible, then whatever remains, however improbable, must be the truth.” ~ Arthur Conan Doyle, The Case-Book of Sherlock Holmes
 

Offline peter-hTopic starter

  • Super Contributor
  • ***
  • Posts: 3697
  • Country: gb
  • Doing electronics since the 1960s...
Re: Heap analysis tool for embedded systems
« Reply #16 on: April 27, 2023, 07:29:31 pm »
I have just been rigorously testing the heap implementation in my product and found this


I am malloc'ing 16 byte packets and filling each one with 0x77. Out of about 56k RAM I managed to get 2437 blocks. Then I went to look at the data and you can see there are 8 bytes of some metadata for each allocated block.

Presumably the 0x00000019 (25 decimal) relates to the block size of 16. Well, it is 9 bigger :) What the other 8 bytes mean I have no idea but it isn't a simple address, or even an address increment.
« Last Edit: April 27, 2023, 07:39:17 pm by peter-h »
Z80 Z180 Z280 Z8 S8 8031 8051 H8/300 H8/500 80x86 90S1200 32F417
 

Offline SiliconWizard

  • Super Contributor
  • ***
  • Posts: 14476
  • Country: fr
Re: Heap analysis tool for embedded systems
« Reply #17 on: April 27, 2023, 07:33:18 pm »
I have just been rigorously testing the heap implementation in my product and found this


I am malloc'ing 16 byte packets and filling each one with 0x77. Out of about 56k RAM I managed to get 2437 blocks. Then I went to look at the data and you can see there are 8 bytes of some metadata for each allocated block.

All malloc implementations that I know of use some metadata for each allocated block. That's the very standard way of implementing malloc.

So yes, that makes allocating small blocks very inefficient. If you need to manage the allocation of small blocks, you'll need to write your own allocation scheme on top of malloc.
The most basic one is to allocate "arrays" and then suballocate items inside them using your own functions.

Or did I miss something in the fact you seemed to be surprised about those 8 extra bytes?
 

Offline peter-hTopic starter

  • Super Contributor
  • ***
  • Posts: 3697
  • Country: gb
  • Doing electronics since the 1960s...
Re: Heap analysis tool for embedded systems
« Reply #18 on: April 27, 2023, 07:42:33 pm »
You missed nothing. I am just testing the heap code, and decided to reduce the blocks to silly small size to home in on the actual overhead. This would be a stupid scheme in reality.

Obviously there has to be metadata otherwise a free() is not possible. Maybe it is a linked list...

From my notes a year ago, some Newlib sources can be found here
https://developer.arm.com/downloads/-/arm-gnu-toolchain-downloads
but I didn't go looking at which one it is.

It would be interesting if there was a tool for displaying the allocated blocks. I already have a GUI tool for displaying the RTOS stack space etc.
« Last Edit: April 27, 2023, 08:02:19 pm by peter-h »
Z80 Z180 Z280 Z8 S8 8031 8051 H8/300 H8/500 80x86 90S1200 32F417
 

Offline ejeffrey

  • Super Contributor
  • ***
  • Posts: 3719
  • Country: us
Re: Heap analysis tool for embedded systems
« Reply #19 on: April 27, 2023, 10:09:12 pm »
I have just been rigorously testing the heap implementation in my product and found this


I am malloc'ing 16 byte packets and filling each one with 0x77. Out of about 56k RAM I managed to get 2437 blocks. Then I went to look at the data and you can see there are 8 bytes of some metadata for each allocated block.

Presumably the 0x00000019 (25 decimal) relates to the block size of 16. Well, it is 9 bigger :) What the other 8 bytes mean I have no idea but it isn't a simple address, or even an address increment.

It's hard to tell without looking at the implementation.  It might be nothing.  malloc() is required to only return pointers aligned for any data type.  That usually means 8 bytes (most platform ABIs require doubles to be 8 byte aligned, and do that even if you compile for an implementation with no FPU).  So if you request 16 and malloc needs 4 bytes for bookkeeping, that leaves 4 unused bytes for every allocation.  Try allocating 12 bytes or 20 bytes and see what happens. 
 

Offline SiliconWizard

  • Super Contributor
  • ***
  • Posts: 14476
  • Country: fr
Re: Heap analysis tool for embedded systems
« Reply #20 on: April 28, 2023, 12:52:19 am »
You missed nothing. I am just testing the heap code, and decided to reduce the blocks to silly small size to home in on the actual overhead. This would be a stupid scheme in reality.

Well, it would be ill-advised, but you'd be surprised - there are probably many people doing just that, malloc'ing very small blocks one by one, like if they implement a very naive linked list of small objects. That's something you should avoid, but I'm not sure that many people are actually aware of it, until it bites them in the ass.

For newlib's malloc, you can have a look there, line 1274:
https://github.com/devkitPro/newlib/blob/master/newlib/libc/stdlib/_mallocr.c

A chunk contains exactly two words before the 'user data', so that would be your 8 bytes.
« Last Edit: April 28, 2023, 01:00:36 am by SiliconWizard »
 

Offline peter-hTopic starter

  • Super Contributor
  • ***
  • Posts: 3697
  • Country: gb
  • Doing electronics since the 1960s...
Re: Heap analysis tool for embedded systems
« Reply #21 on: April 28, 2023, 07:05:31 am »
Ah, yes, very clever how you find this stuff :)

However, this isn't exactly my Newlib sourcecode. I looked through Cube IDE disassembly of mine, when looking to fix the stupid empty mutex stubs. The ST lib was not "weak" so they could not be replaced in the obvious way (see other threads on weakening the whole libc.a using objopy) and it had calls to dummy mutex functions, around the entry and exit. It could be the same sourcecode apart from that though.

It seems to work fine. I am running malloc/free fairly randomly, at ~10Hz, with a 1k and a 48k block, within a heap area of about 56k (so I reckon fragmentation is impossible) while running the whole box, loads of RTOS tasks, comms, TLS "concurrently" to two peers (TLS uses the 48k block for its private heap which uses another heap code) and there is no leakage.

Well, the sourcecode is probably the 1990 Newlib (the source was found for the printf, now replaced with one which doesn't need mutex protection) so they've had 33 years to fix the bugs :)

I think mutex protection on malloc/free cannot be avoided if you want it thread-safe (multiple RTOS tasks using it). My box doesn't use the heap in any way which could ever fragment, FWIW.

Quote
Try allocating 12 bytes or 20 bytes and see what happens.

This is really strange!


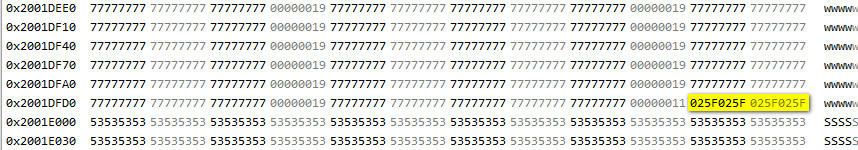
Just 4 bytes between the 20 byte blocks, and they are all the same. So it looks like the previous data was just garbage.

The yellow bit is just the remainder of the heap area which could not be allocated for a 20 byte block.

The "S" is the stack area, which (as traditionally) starts after the top of the heap. The top 8k (2001E000-FFFF) of the RAM is the 8k stack. That one is used only for interrupts.

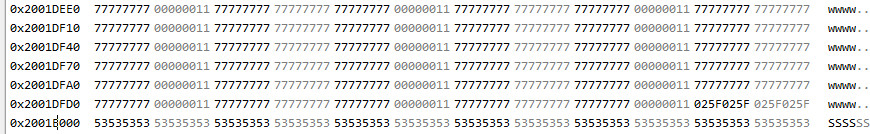
This is the 12-byte case:


Code: [Select]
int x=1;

while (true)
{

osDelay(100);

char *buf = malloc(12);

if ( buf==NULL)
{
printf("malloc failed, x=%d",x);
x++;
}
else
{
printf("malloc good, x=%d",x);
x++;
// fill the block with 0x77
for (int a=0; a<12; a++)
{
buf[a]=0x77;
}
//free(buf);
}


}

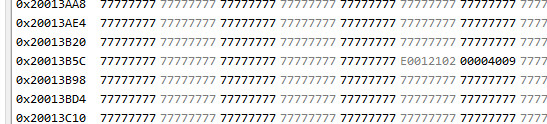
With a 16384 block, I see 4 bytes of (probably) garbage and 0x00004009


BTW does anyone know what exactly _sbrk is supposed to do? I am finding conflicting stuff on the net. It is a simple function which takes in a value called incr (which it turns out is not the size of the requested block, but mine seems to get called with a sequence of power of 2 values like 4096 8192 etc) and has access to labels representing the end of BSS and the base of stack i.e. the extent of the RAM available for the heap. And it is not getting called on every malloc.

Another test, a repeated 50000 byte malloc/free, calls _sbrk just on the 1st malloc, with an incr value of Decimal 53248 / Hex:0xd000. However, this is probably right since the source https://github.com/devkitPro/newlib/blob/master/newlib/libc/stdlib/_mallocr.c describes how padding is used to avoid calling _sbrk too often. Therefore the heap code must be using that 1st call to _sbrk to obtain the heap area extents and then it stores them locally. But that would make it non thread safe - although all RTOS tasks would be sharing the same area so maybe it's OK.

My current _sbrk

Code: [Select]


// This is used by malloc().

caddr_t _sbrk(int incr)
{

// These are defined in the linkfile
extern char end asm("_end");
extern char top asm("_top");

static char *heap_end;
char *prev_heap_end;

// This sets heap_end to end of BSS, on the first call to _sbrk
if (heap_end == 0)
heap_end = &end;

prev_heap_end = heap_end;

// top = top of RAM minus size of stack
if ( (heap_end + incr) > &top )
{
// write(1, "Heap and stack collision\n", 25);
// abort();
errno = ENOMEM;
return (caddr_t) -1;
}

heap_end += incr;

return (caddr_t) prev_heap_end;

}

Am I right that the line
   if (heap_end == 0)
should be
   if (heap_end == NULL)
« Last Edit: April 28, 2023, 07:59:49 pm by peter-h »
Z80 Z180 Z280 Z8 S8 8031 8051 H8/300 H8/500 80x86 90S1200 32F417
 

Offline ejeffrey

  • Super Contributor
  • ***
  • Posts: 3719
  • Country: us
Re: Heap analysis tool for embedded systems
« Reply #22 on: April 28, 2023, 08:49:35 pm »
BTW does anyone know what exactly _sbrk is supposed to do? I am finding conflicting stuff on the net. It is a simple function which takes in a value called incr (which it turns out is not the size of the requested block, but mine seems to get called with a sequence of power of 2 values like 4096 8192 etc) and has access to labels representing the end of BSS and the base of stack i.e. the extent of the RAM available for the heap. And it is not getting called on every malloc.

sbrk increases the size of the data segment.  It is used to reserve new memory.

The relationship to malloc() is that sbrk linearly grows (and normally does not every shrink) the data segment.  So when you call malloc(), first it will look at the freelists to see if it already has a chunk of memory that can satisfy the request.  If not, it will call sbrk() to allocate a chunk of memory, but it might allocate more than it needs for this one request.

Quote
I think mutex protection on malloc/free cannot be avoided if you want it thread-safe (multiple RTOS tasks using it). My box doesn't use the heap in any way which could ever fragment, FWIW.

That depends on the implementation.  sbrk() intrinsically needs to be locked because it affects the shared program break, but a lot of thread safe malloc() implementations use per-thread memory pools so that they can have a lock free fast path.  They still need locks to move freed memory from one thread to another.  For instance if you always malloc() in one thread and free() in another, you need to eventually return the memory to the original thread, but that locking cost can be amortized over multiple calls.
 

Offline peter-hTopic starter

  • Super Contributor
  • ***
  • Posts: 3697
  • Country: gb
  • Doing electronics since the 1960s...
Re: Heap analysis tool for embedded systems
« Reply #23 on: April 28, 2023, 09:38:41 pm »
In that case, since my malloc() is mutexed, _sbrk() will also be protected inside that mutex region.

The way my _sbrk works is too opaque for my knowledge of C. There is some subtle stuff there around
static char *heap_end;
which I think assumes that initially this is NULL. Maybe C guarantees that...
Z80 Z180 Z280 Z8 S8 8031 8051 H8/300 H8/500 80x86 90S1200 32F417
 

Offline SiliconWizard

  • Super Contributor
  • ***
  • Posts: 14476
  • Country: fr
Re: Heap analysis tool for embedded systems
« Reply #24 on: April 29, 2023, 01:04:55 am »
In that case, since my malloc() is mutexed, _sbrk() will also be protected inside that mutex region.

The way my _sbrk works is too opaque for my knowledge of C. There is some subtle stuff there around
static char *heap_end;
which I think assumes that initially this is NULL. Maybe C guarantees that...

It does.


Share me

Digg  Facebook  SlashDot  Delicious  Technorati  Twitter  Google  Yahoo
Smf