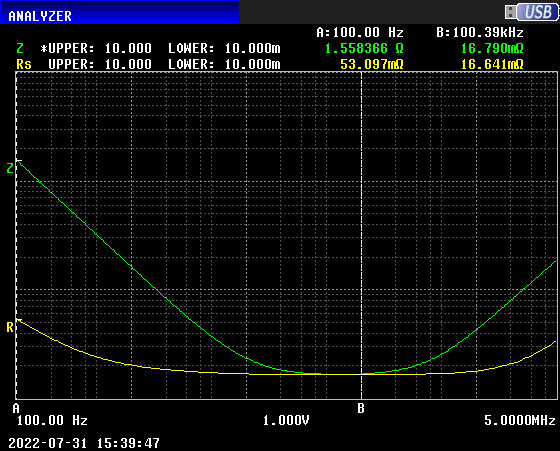
Here are a couple of plots vs frequency of parameters of a 1000uF 16v Rubycon capacitor. The first plot shows the impedance magnitude |Z| (green) and ESR (yellow) over a frequency range of 100 Hz to 5 Mhz. You can see that starting at the left at 100 Hz, |Z| decreases with increasing frequency as we would expect for a capacitor, but somewhere before 100 kHz where marker B is, |Z| begins to increase. A |Z| that increases with frequency is behavior that we would expect from an inductor, and that increase is due to the ESL (equivalent series inductance) of the capacitor. The capacitance of the capacitor resonates with the ESL of the capacitor just below (it's at marker A in the second image) the frequency where marker B is; this is called the self resonance frequency of the capacitor.
At frequencies above the SRF (self resonance frequency), an LCR meter which is set to measure capacitance will show a reading which is negative, because above the SRF the impedance of the capacitor is inductive.

The second plot shows the same yellow curve of the ESR vs frequency, but now the green curve is the phase angle of the impedance of the capacitor being measured. The scale of the linear display is -90 degrees at the bottom, +90 degrees at the top. The green curve starts at the left (100 Hz) near the bottom, so at low frequencies the phase of the capacitor's impedance is nearly -90 degrees. As the frequency increases, the phase moves upward (but is still negative--capacitive in other words) until at marker A (65.027 kHz), the phase has reached zero degrees--the impedance is purely resistive. Continuing up in frequency, the phase angle continues to increase toward +90 degrees, staying positive, which means it's inductive.
Notice the behavior near 100 kHz; the phase is close to zero degrees, and it can't be -82.7 degrees.
