Author Topic: Functional comparison of R&S RTB2000, Siglent SDS2000X and Keysight DSOX1000  (Read 29537 times)

0 Members and 1 Guest are viewing this topic.

Offline RBBVNL9Topic starter

  • Frequent Contributor
  • **
  • Posts: 326
  • Country: nl
Thanks for the replies and compliments.

Quote
The Bode Plot in the Siglent is slow, especially at low frequencies.
Quote
Like Performa said, it uses frequency selective algorithm,

I djust did some more tests and I can confirm the speed is frequency dependent indeed (and will update the future comparison document):


Quote
That makes it have very good dynamic range and more robust if you are not working in a Faraday cage.
Great, but I would have wished that the user could choose to have such strategies in place or not. In my test case (and I think in many user's test cases) a Faraday cage neither special strategies to deal with very low signals or wide dynamic range are needed. Unless such special situations apply, I would rather like the instrument to be more responsive.

Quote
Your complaint about not being able to set fine steps for the amplitude axis has aready been addressed in the SDS2000X HD and will be available in the next SDS2000X Plus firmware. We can now set the scale in 1 dB increments.
Good to know. I don't own that HD scope, but once the firmware update for the SDS2000X Plus is out that fixes this and I have been able to test it, I'm happy to update my comparison document!

Quote
Your complaint about not being able to have a look at the time domain view has aready been addressed in the SDS2000X HD and will be available in the next SDS2000X Plus firmware.
Same as above!


The following users thanked this post: Performa01, 2N3055

Offline rf-loop

  • Super Contributor
  • ***
  • Posts: 4104
  • Country: fi
  • Born in Finland with DLL21 in hand
Thanks for the replies and compliments.

Quote
The Bode Plot in the Siglent is slow, especially at low frequencies.
Quote
Like Performa said, it uses frequency selective algorithm,

I djust did some more tests and I can confirm the speed is frequency dependent indeed (and will update the future comparison document):

[ Attachment Invalid Or Does Not Exist ]

Quote
That makes it have very good dynamic range and more robust if you are not working in a Faraday cage.
Great, but I would have wished that the user could choose to have such strategies in place or not. In my test case (and I think in many user's test cases) a Faraday cage neither special strategies to deal with very low signals or wide dynamic range are needed. Unless such special situations apply, I would rather like the instrument to be more responsive.

Quote
Your complaint about not being able to set fine steps for the amplitude axis has aready been addressed in the SDS2000X HD and will be available in the next SDS2000X Plus firmware. We can now set the scale in 1 dB increments.
Good to know. I don't own that HD scope, but once the firmware update for the SDS2000X Plus is out that fixes this and I have been able to test it, I'm happy to update my comparison document!

Quote
Your complaint about not being able to have a look at the time domain view has aready been addressed in the SDS2000X HD and will be available in the next SDS2000X Plus firmware.
Same as above!


In your table there is no information if Siglent was tested using automatic level control (ALC), on or Off  (In Siglent "language" it is: Channel Gain: Auto or Manual)
It affect to speed some amount. Naturally because when ALC os ON, after every single frequency step it need check signal level. It is capable to adjust full dynamic range and independently for every channel in use, what is from noise level to max,  around -100dBm to 42dBm // -113dBV to 29dBV. Step from minimum to maximum can happen in every single frequency step.
Naturally if use manual, then user need first find max level so that set channels V/div so that signal stay enough under clipping level.
If need test circuits where do not need high dynamic range least I use mostly Manual. Example if 50ohm system and 0dBm is max level. Just 100mV/div and there is still over 60dB dynamic range down from this 0dBm. Even more, depending how much we accept noise affect/reduce level accuracy. With 100mV/div 50ohm  BodePlot noise level is somewhere below -80dBm  (depending frequency)


If you put these equipments to bit more challenging tests it can tell much more. If compare just using simplest possible tests all can do these simple kind of RC filter class tests if need tell students what is BodePlot. Or just how fast it can plot.

Here some tiny and simple examples.
First one is simplest RC. There is cascaded LPF and HPF.  CH3 after HPF and CH2 and 4 bit different position near final.   All can do this. (except only Siglent 3 channels simultaneously. But dynamic range is still very easy)


Then next one is perhaps bit more challenging least to some of oscilloscopes what have BodePlot (or Freq. Response Analyzer or Control Loop Response Analyzer)
In this next image below. Playing with attenuator as DUT. Signal to DUT is 0dBm. As can see when attenuator is 0dB it is. Then attenuator down to 100dB and Result is -100dBm.
As can see frequency here was around 455kHz for look dynamic range if measure and characterize example typical 2nd or 3rd IF filters in some analog receiver. 100dB dynamic down from 0dBm is not at all bad when we talk just basic level oscilloscope.
As can see there is also one channel open for display just noise level.  (also note explanations below image)

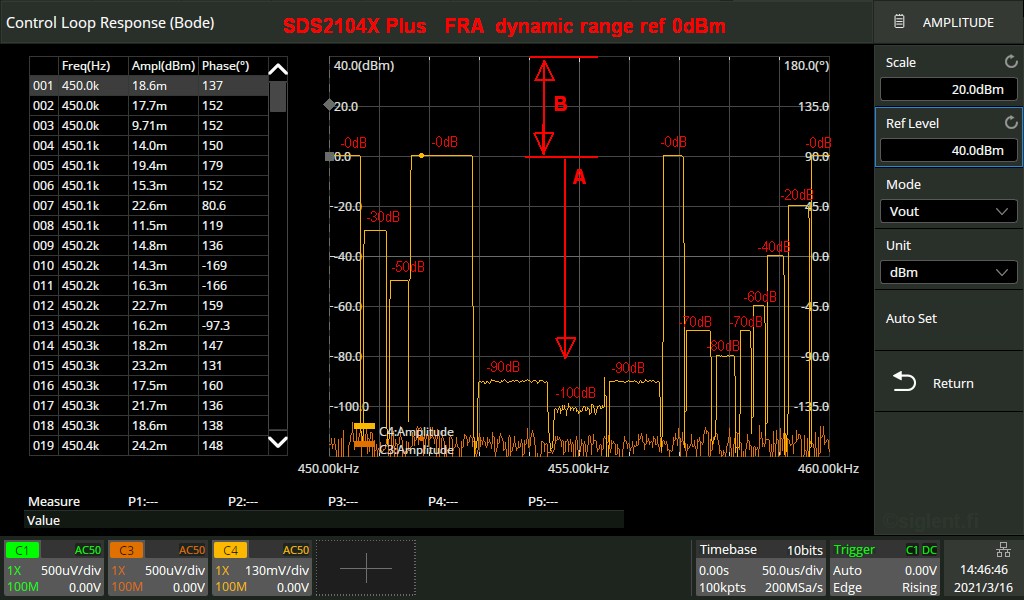
(in this image I do not remember at all what was FW version but far below today versions)
NOTE: In this time when I did this I have big troubles with attenuator control signals so it is as it is... and after then never made repeat using adjustable good HP step atten.
But, I know this attenuator steps have less than +/-0.5dB error 0 to 80dB and less than +/- 1dB >80 to 110dB.

And now if there is filter as DUT what have stop band attenuation -100dB then result is same...
This level range marked as A and B in picture contain full FRA 140dB dynamic range. But naturally with internal 50ohm can not. Then need external load. (this may happen if example DUT have also amplification. With Passive DUT and Siglent generaton, full dynamic range is of course more low because max output level)


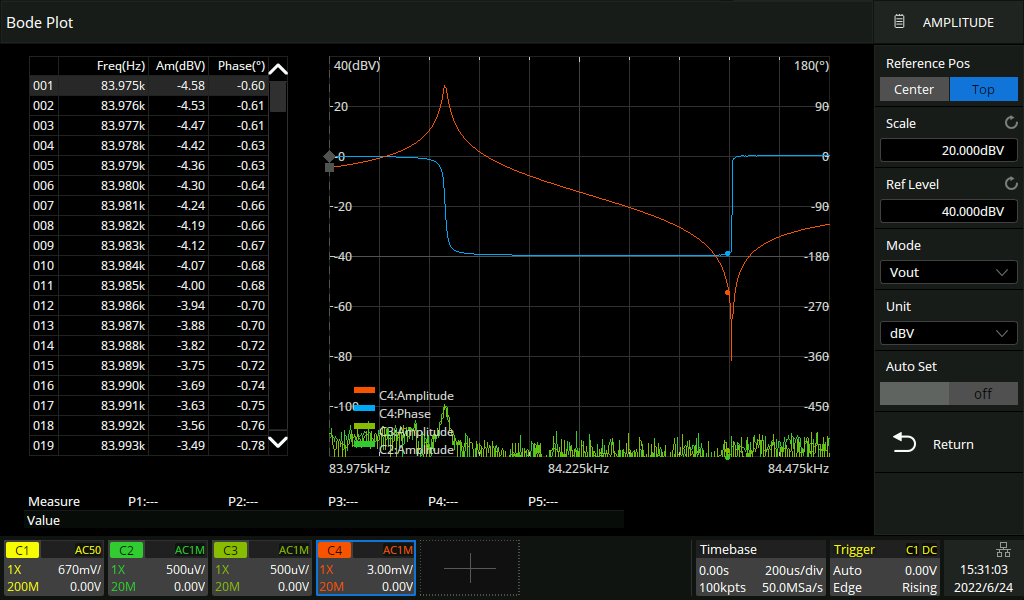
Then this next. This is made using SDS2000X HD  but it do not matter here "anything". Because resolution is resolution and it do not directly affect dynamic range itself. HD model noise level is tiny bit better than 2kX+ but if we look whole dynamic range this difference is nearly nonsense in this case. (So, afaik, SDS2kX+ can easy do this same)
Here is tested 84.050kHz high quality vacuum tube type quarz resonator.  As can see even Siglent FRA frequency resolution is just borderline or better say not enough (look this fs and fp points level difference... f resolution for fp peak is clearly/barely just enough but for fs there is not enough frequency resolution so it is just one step and now it depends if this step frequency is just perfect or 0.5Hz off what may do big difference in level. 
Other channels (2 and 3) are just for give imagination of noise level. And there can see also crosss talk. As can see when CH4 level is most high (resonator highest peak) also it can see over CH2 and 3 noise level (>10dB peak). Still over 120dB distance.


I do not know how are these others but least Siglent is based fully to primary data table what it produce doing sweep. (if select data table to display this is only reduced version from primary table) Bode traces display is only graphic "window" to this primary data table. If data is outside of display window when it sweep, it do not matter anything, result go still to primary table (just move/change your "window" vertical pos and scale to see it.) Sad it can do only this in vertically, not horizontally (not pan and zoom horizontally).  It is not "display plotter" is is database plotter. Then you adjust your display window how you want. (exept if you want use this "blond" method Auto adjust). Also internal data table(s) have full resolution (not truncated or rounded as in visible table). This primary table can take out  example using .CSV  format. (also it can read back to scope for later look again with B.)

Also, Siglent make possible to use external Siglent generators what give lot of more features. Example test circuits what convert frequency. (DUT in and out frequencies are different). In some of this kind of cases it is very important to listen and measure wanted frequency and not example mirror freq. So freq selectivity may have also other aspects than just reduce "noise" etc..   Some simplest BodeToy machines may measure even what ever... just wide band amplitude what may include all dirties and mess. Also using dual channel generator for FRA make possible to use different levels for reference channel and DUT inputs, for example reduce oscilloscope channels internal cross talk effect when DUT in level is high but DUT out level is very very low... example with high quality IF filters stop band levels or specially if filters are higher freq where cross talk may be much more problem.

But, still also I hope Siglent can later implement "fast mode" for simplest circuits Bode just for fast sweep some RC filter where do not need anything but find signal level and phase just without any more sophisticated things.  Just like we old time did "Bode" with sweeper, scope  and detector (or even logamp/detector because with linear scale reading from scope screen is... totally poor.).

(eta: corrected some most bad typing errs)
   
« Last Edit: June 25, 2022, 02:06:12 pm by rf-loop »
I drive a LEC (low el. consumption) BEV car. Smoke exhaust pipes - go to museum. In Finland quite all electric power is made using nuclear, wind, solar and water.

Wises must compel the mad barbarians to stop their crimes against humanity. Where have the wises gone?
 
The following users thanked this post: Performa01, 2N3055, Martin72

Offline RBBVNL9Topic starter

  • Frequent Contributor
  • **
  • Posts: 326
  • Country: nl
Dear RFloop,

Quote
In your table there is no information if Siglent was tested using automatic level control (ALC), on or Off  (In Siglent "language" it is: Channel Gain: Auto or Manual)

Quick answer: on all three scopes, automatic level control was used during my speed tests. Will add that to the table. In fact, for the RTB and the DSOX, this mode is always on (see my overview document). On the RTB and the SDS screen, one can see the actual gain selected at any moment for the scope channels. With the DSOX, that is not visible when running the analysis.
 
The following users thanked this post: rf-loop, 2N3055, trp806mo

Online pdenisowski

  • Frequent Contributor
  • **
  • Posts: 626
  • Country: us
  • Product Management Engineer, Rohde & Schwarz
    • Test and Measurement Fundamentals Playlist on the R&S YouTube channel
Hi Rudi -- thanks for the very nice video!  A couple of additional points about Bode plots on the RTB:

1) Horizontal scaling of the gain and phase is possible: you can use the horizontal rotary knobs, start and stop frequency, or "pinch" gestures to scale the results horizontally.

2) You can also use the Autoset key to scale the Bode plot automatically

3) HiRes mode is switched on during Bode plot measurements, and this provides up to 16-bit resolution

Again, many thanks!  Looking forward to the next video.
« Last Edit: June 27, 2022, 09:49:25 am by pdenisowski »
Test and Measurement Fundamentals video series on the Rohde & Schwarz YouTube channel:  https://www.youtube.com/playlist?list=PLKxVoO5jUTlvsVtDcqrVn0ybqBVlLj2z8

Free online test and measurement fundamentals courses from Rohde & Schwarz:  https://tinyurl.com/mv7a4vb6
 
The following users thanked this post: egonotto, 2N3055

Offline Anthocyanina

  • Frequent Contributor
  • **
  • Posts: 340
  • Country: 00
  • The Sara
Just watched the new episode, I would like to know how they perform when encountering a phase shift beyond +-180°. The Keysight 1102g has this thing where it can't determine if the phase is + or - 180° so you see jumps like this when it crosses either point, could you test for this on the 1204g and the others? thank you!
 
The following users thanked this post: RBBVNL9

Offline RBBVNL9Topic starter

  • Frequent Contributor
  • **
  • Posts: 326
  • Country: nl
@pdenisowski

Thanks, Paul, thanks for the compliments. Just did one more test prompted by your message and I indeed do now see how the horizontal scale can be edited after the measurements are done (your point 1) - will add it to the overview table. The topic of resolution/dynamic range for Bode plots is a complex one. For each new measurement, the instrument may reconsider the appropriate channel gain for the measurement, so it is not only dependent on the resolution of the ADC or other related measures (like averaging) but also the ability to jump to the right channel gain, and the highest available channel gain (and its noise floor). So the dynamic range may be more than 8, 10 or even 16 bit would allow for, but how much, depends on other factors.

Topic of next video is not yet decided but it might well be ... FFT
 
The following users thanked this post: pdenisowski, Anthocyanina

Offline RBBVNL9Topic starter

  • Frequent Contributor
  • **
  • Posts: 326
  • Country: nl
Quote
Just watched the new episode, I would like to know how they perform when encountering a phase shift beyond +-180°. The Keysight 1102g has this thing where it can't determine if the phase is + or - 180° so you see jumps like this when it crosses either point, could you test for this on the 1204g and the others? thank you!

Thanks. I recall that the RTB allows you to set the way it 'jumps' when large phase shifts occur. Time permitting I will do the test you asked for - let me see of I have a nice DUT lying around that makes such shifts.
 
The following users thanked this post: Anthocyanina

Offline Anthocyanina

  • Frequent Contributor
  • **
  • Posts: 340
  • Country: 00
  • The Sara
...

Topic of next video is not yet decided but it might well be ... FFT

Ooh! perhaps you might want to cover this if you do FFT next(or anyone else might know what's going on in here?). I'm not sure if this is a thing with just my unit, or if it's a thing with the model, or if it's different between the 1102 and 1204 series, but I found that when doing FFT at slower timebases for higher RBW, at certain timebases the FFT would just cut off on the right, and the resolution would show up as higher, and then if you move it to either faster or slower timebases, it would expand again and show lower resolution, all this within the 2GSa/s limit of 20µs/. So i find this very strange that if sampling rate isn't changing, the FFT is still cutting off  :scared:

In the screenshots you can see how going from 18µs/ to 18.4 the FFT resolution seems to increase but it chops off the right side, and then changing from 18.4µs/ to 19.2 it comes back, but the resolution seems to go down again.
 

Offline RBBVNL9Topic starter

  • Frequent Contributor
  • **
  • Posts: 326
  • Country: nl
On request, I have decided to do the FFT episode as the next one in the series. It's quite an extensive topic to cover, resulting in a mammoth video… But I have provided extensive TOC (so you can jump to what you want to see), and I’m sure there are new insights things to be discovered by everyone, also the most seasoned users of these oscilloscopes! 

Once again, the comparison document is updated (now 54 pages, 267 footnotes, quite some detail….).

Enjoy!
Rudi


The following users thanked this post: rf-loop, Performa01, egonotto, tv84, 2N3055, Markus2801A, Anthocyanina, Detlev, arvidb

Offline 2N3055

  • Super Contributor
  • ***
  • Posts: 6623
  • Country: hr
On request, I have decided to do the FFT episode as the next one in the series. It's quite an extensive topic to cover, resulting in a mammoth video… But I have provided extensive TOC (so you can jump to what you want to see), and I’m sure there are new insights things to be discovered by everyone, also the most seasoned users of these oscilloscopes! 

Once again, the comparison document is updated (now 54 pages, 267 footnotes, quite some detail….).

Enjoy!
Rudi


Hello Rudi.

I must say that I didn't have time to watch your quite lengthy video in details..
Quite frankly, I don't really agree with some of methodology, and there are some omissions that I caught by only cursory watching..

Let's just touch on some of those, without particular order.

RBW is resolution bandwidth, not realtime bandwidth. You confused them when talking about R&S.

First, there is no RBW in FFT, really. With FFT we talk about frequency bin size (or bin width, or bin spacing).  RTB doesn't have regular FFT implementation. What they have is kind of simplified version of spectrum mode from it's "bigger" brethren..
It is nor proper spectrum mode, nor propper FFT.  That makes it easier to use because it speaks of RBW (while I don't know if they are really calculating proper spectrum plot with recalculated bins to RBW and amplitude and scalloping loss and frequency leakage corrections in accordance with used FFT window etc..) and other parlance like you are using SA..  I presume R&S did it right ( because they should know how it's done) but I don't understand how it is implemented.

FFT is more basic mathematical transformation than full SA implementation. R&S implementation gets you quicker something on the screen, but if you are doing something where FFT needs to be set exactly in some way, R&S is not good for that.
It depends on usage, I guess.

Fact that FFT in RTB2000 takes over control of the scope is annoying as hell to me, personally.. 

On SDS2000X+, sort peaks (frequency/amplitude) is applied to TABLE view. Peaks markers are always enumerated from left to right in increasing number order.

Noise floor comparisons are valid only if you have exactly same number of data points, time interval bins, averaging and same windowing. Otherwise they will differ..

On SDG2000 (or 6000) you don't need to press amplitude for few seconds to get dBm. If you have it set for 50 Ohm, you simply start typing number 0 and press dBm like you did..

I will look at the video in more detail later.. It is kinda busy these days...

Please don't take this as offense. The topic is quite complicated and it is very involved to create representative presentation.. It is obvious a lot of work is put in it. Minor errors are understandable..

Best
Sinisa
 
The following users thanked this post: rf-loop, egonotto, Markus2801A

Offline RBBVNL9Topic starter

  • Frequent Contributor
  • **
  • Posts: 326
  • Country: nl
Sinisa, thanks for the detailed feedback. Seems you looked at the video more than just cursory (or you’re a very efficient watcher ;-)

Let me react to a couple of things you bring up. Firstly:

Quote
Please don't take this as offense. The topic is quite complicated and it is very involved to create representative presentation.. It is obvious a lot of work is put in it. Minor errors are understandable..

Thanks for noting this. I have benefited a lot from reviews of others when choosing or using measurement instruments, and with this series, I hope to contribute myself to the community. But – needless to say –  there inevitably will be mistakes, omissions, and perhaps misunderstandings. Especially on a topic as complex as FFT.

Quote
First, there is no RBW in FFT, really

Concerning the use of the term RBW, I guess it’s a bit of a matter of terminology… While there is some divergence in the use of this term, Rohde & Schwarz is certainly not the only one using the term RBW in the context of FFT/DFT. Some examples:
  • National Instruments (NI) explains the term as follows: “The resolution bandwidth (RBW) determines the fast-Fourier transform (FFT) bin size, or the smallest frequency that can be resolved.” (source).
  • Tektronix writes: “On traditional SAs, the IF filter bandwidth determines the ability to resolve adjacent signals and is also called the resolution bandwidth (RBW). For example, in order to resolve two signals of equal amplitude and 100 kHz apart in frequency, RBW needs to be less than 100 kHz. For spectrum analyzers based on the DFT technique, the RBW is inversely proportional to the acquisition time. Given the same sampling frequency, more samples are required to achieve a smaller RBW. In addition, windowing also affects the RBW.” ( source).
  • I also see RBW shown on the screen of some other brands of scopes with FFT, such as the GW INSTEK MDO-2000E (screenshot here).

But there is divergence indeed. The SDS shows an “∆f” value, and the DSOX shows an “FFT Resolution” value on the screen... I have been under the impression that all of these basically refer to the same thing, but correct me if I’m wrong… This is what the oscilloscope manuals have to say:
  • RTB: “The resolution bandwidth (RBW) determines the resolution of the spectrum, that is: the minimum distance between two distinguishable peaks. The higher the resolution (the smaller the ratio), the more peaks are detected, but the longer the measurement requires to finish.”
  • SDS: “Frequency interval (△f): The frequency interval between two adjacent points in the FFT sequence, which is proportional to the frequency resolution.” (Note: I have to think about this ‘proportional….’. The same? With some factor?)
  • DSOX: “The FFT resolution is the quotient of the sampling rate and the number of FFT points (fS/N). With a fixed number of FFT points (up to 65,536), the lower the sampling rate, the better the resolution.”

Quote
RBW is resolution bandwidth, not realtime bandwidth.

Indeed, during the recordings, I accidentally said ‘real-time bandwidth’ instead of ‘resolution bandwidth’; I thought I corrected that (I did so at 2:01:47, for instance), but I must have overlooked one or more. My bad. 

Quote
RTB doesn't have regular FFT implementation. What they have is kind of simplified version of spectrum mode from it's "bigger" brethren..

I don't think I came across this before. Do you have any sources or further information? Trying to look this up, I came across a of how R&S implemented FFT in the RTO oscilloscopes (including downconverting and overlapping blocks), but I have no idea this is also the implementation used in the RTB. There does not seem much to find on this on the internet.   

Quote
Fact that FFT in RTB2000 takes over control of the scope is annoying as hell to me, personally. 

Yes, I see your view. In a FAQ, R&S writes “The timebase is adapted automatically when the frequency parameters of the FFT are changed. This is done to archieve optimized results. You can change the timebase in indirect way, if you change the span. Increase the span --> the timebase becomes faster Decrease the span --> the timebase becomes slower” But this may not be as much flexibility as you wish, as you may want to determine your span on other grounds. You do have the possibility to set the time gate (= extract of the timebase for which the FFT is calculate) on the RTB with the Width and Position parameters. Do play with that! But having that said, indeed, you cannot set time base, sample rate and memory depth yourself as in other instruments.

Quote
On SDG2000 (or 6000) you don't need to press amplitude for few seconds to get dBm. If you have it set for 50 Ohm, you simply start typing number 0 and press dBm like you did..

That is true. But I use the method shown in my video because I like to see first what the current setting in dBm is, before I change it into another dBm value… Matter of preferences, I guess.

I am not exactly sure what you mean to say. If it ‘sort on peaks’ does not sort the table, then what does it do? On my device, I see no difference whether I select “Sort to @@” or “Sort to peaks” I get the same table, same marker numbering, etc.

Quote
On SDS2000X+, sort peaks (frequency/amplitude) is applied to TABLE view. Peaks markers are always enumerated from left to right in increasing number order.

I looked at it again, and… now I see your point. The “sort by” does not sort the numbers give to the peak markers, but the order in which they are shown in the table. Not sure why I did not see that before.

But the fact the SDS manual says "Sort peaks by amplitude or frequency" instead of "Sorts the table by amplitude or frequency" does not help, though.

Quote
Noise floor comparisons are valid only if you have exactly same number of data points, time interval bins, averaging and same windowing. Otherwise they will differ..

Yes, and that is exactly why I added the section starting at 2:01:15 to the video. To point out that all these parameters do matter and affect the outcomes. Since it is impossible to set all devices to exactly the same settings, for most tests I did, I tried to take a users’ perspective and find the best settings I could achieve for each device (and when I do this best-achieved results approach, I say it in the video). For the speed test, however, I tried to test with settings that were as close as possible (and I mention this also in the video).

Again, thanks for the feedback,
Best, Rudi
 
The following users thanked this post: egonotto, 2N3055, Markus2801A, Detlev

Online Performa01

  • Super Contributor
  • ***
  • Posts: 1642
  • Country: at
For the FFT math, the correct term for the frequency spacing is "bin-width". For a 1 Mpts FFT at 1 GSa/s, if you have a mega (1048576) bins, each of them is 953,67 Hz wide.

The effective Resolution Bandwidth (RBW) is closely related to the bin-width, but not identical. There is a factor involved, depending on the window function in use.

In theory, that factor ranges from 0.89 (Rectangle) up to 2.94 (Flattop), yet when I last measured it, the Flattop window in some Siglent DSO required a factor of 3.8 to determine the true -3 dB bandwidth. Rectangle window is to be avoided except some very special applications like short transients, whereas Flattop is the most accurate window function that is universally used in spectrum analyzers.
« Last Edit: July 15, 2022, 08:11:17 am by Performa01 »
 
The following users thanked this post: egonotto, 2N3055, skander36, Markus2801A, RBBVNL9

Offline rf-loop

  • Super Contributor
  • ***
  • Posts: 4104
  • Country: fi
  • Born in Finland with DLL21 in hand
For the FFT math, the correct term for the frequency spacing is "bin-width". For a 1 Mpts FFT at 1 GSa/s, if you have a mega (1048576) bins, each of them is 953,67 Hz wide.

The effective Resolution Bandwidth (RBW) is closely related to the bin-width, but not identical. There is a factor involved, depending on the window function in use.

In theory, that factor ranges from 0.89 (Rectangle) up to 2.94 (Flattop), yet when I last measured it, the Flattop window in some Siglent DSO required a factor of 3.8 to determine the true -3 dB bandwidth. Rectangle window is to be avoided except some very special applications like short transients, whereas Flattop is the most accurate window function that is universally used in spectrum analyzers.

Just measured 2000X HD.

Using center f ~800kHz (freq. fine adjusted to nearest bin)
Flattop window.
FFT ∆f 5.96Hz (FFT 2.5MSa/s, 2Mpts)
-3dB Bandwidth (=RBW) 21.2Hz  and width at -60dBc  54Hz. (shape factor ~2.55)
(Using 200Hz span, I have measured from linear interpolated lines between bin points (just as FFT draw it))

In this case Flat top window responds RBW  3.56 x FFT ∆f 

(example Tektronix tell FlatTop window factor is 3.77)
« Last Edit: July 15, 2022, 10:17:33 am by rf-loop »
I drive a LEC (low el. consumption) BEV car. Smoke exhaust pipes - go to museum. In Finland quite all electric power is made using nuclear, wind, solar and water.

Wises must compel the mad barbarians to stop their crimes against humanity. Where have the wises gone?
 
The following users thanked this post: egonotto, 2N3055, RBBVNL9

Online pdenisowski

  • Frequent Contributor
  • **
  • Posts: 626
  • Country: us
  • Product Management Engineer, Rohde & Schwarz
    • Test and Measurement Fundamentals Playlist on the R&S YouTube channel
On request, I have decided to do the FFT episode as the next one in the series.

Hi Rudi - Very nice video!  Thanks for making these.

With regards to the RTB and FFT, two small points:

1) You can change the horizontal scaling of the spectrum using the horizontal knob
2) Autoset sets both the channel parameters and the FFT parameters

Thanks again!
Test and Measurement Fundamentals video series on the Rohde & Schwarz YouTube channel:  https://www.youtube.com/playlist?list=PLKxVoO5jUTlvsVtDcqrVn0ybqBVlLj2z8

Free online test and measurement fundamentals courses from Rohde & Schwarz:  https://tinyurl.com/mv7a4vb6
 
The following users thanked this post: 2N3055, RBBVNL9

Offline RBBVNL9Topic starter

  • Frequent Contributor
  • **
  • Posts: 326
  • Country: nl
Performa-01, rf-loop,

Very valuable contributions, thank you. They help to understand the difference between the parameters the devices show.

With some visual comparison with a 800kHz sine wave as input and a Flat Top window, I indeed see when the RTB is set to 209 Hz, the width of lobe (using cursors) is approximately the same as the lobe on the SDS with FFT ∆f equal to 76 Hz. That would indeed be in line with a factor of approx. 3.5, as you both explain. The DSOX is the same as the SDS in this respect.

So, my conclusion in terms of the values these devices show on their screens, would be:
  • RTB shows (and allows to set) the RBW, which, when using a Flat Top window, is approximately 3.5 times the FFT frequency spacing (a.k.a. the "bin-width").
  • SDS shows (as a result of the other settings) the “Frequency interval (△f)” which is the same as the FFT frequency spacing (a.k.a. the "bin-width").
  • DSOX shows (as a result of the other settings) the “FFT resolution”, which is, like the SDS, the same as the FFT frequency spacing (a.k.a. the "bin-width").
 
The following users thanked this post: rf-loop, egonotto

Offline RBBVNL9Topic starter

  • Frequent Contributor
  • **
  • Posts: 326
  • Country: nl
dear pdenisowski,

Quote
1) You can change the horizontal scaling of the spectrum using the horizontal knob
2) Autoset sets both the channel parameters and the FFT parameters

Thanks!

I think I had (1) already covered in my video.

Concerning (2), yes, that is interesting, had not realised it. It is not mentioned in the FFT chapter of the RTB manual, though, and only quite limited in the manual's general section (page 51). So this feature could be highlighted a bit more in the manual!   
 
The following users thanked this post: pdenisowski

Offline nctnico

  • Super Contributor
  • ***
  • Posts: 26906
  • Country: nl
    • NCT Developments
I also see RBW shown on the screen of some other brands of scopes with FFT, such as the GW INSTEK MDO-2000E (screenshot here).
Actually that is a spectrum analysis mode. Basically you can divide oscilloscopes in two categories:

1) ones that offer plain FFT and depending on time/div you get a certain bin width (frequency resolution)
2) ones that offer a spectrum analyser-ish interface that optimises time/div and other parameters based on a requested frequency resolution

BTW: The GW Instek 2000E series can do both; there is an FFT mode and spectrum analysis mode (the latter may need some magic using a key generator to enable it on non-MDO versions).

IMHO having a spectrum analyser style interface on top of FFT makes it easier to use. Gettting FFT to do what you want can be tedious while a spectrum analyser interface allows you to go from what you want and let the oscilloscope sort out which settings to use.
« Last Edit: July 15, 2022, 01:40:13 pm by nctnico »
There are small lies, big lies and then there is what is on the screen of your oscilloscope.
 
The following users thanked this post: RBBVNL9

Offline RBBVNL9Topic starter

  • Frequent Contributor
  • **
  • Posts: 326
  • Country: nl
For my RTB, I am doing the calculations as posted above by Performa01 and rf-loop, but I’m not getting what I would expect. Probably I’m doing something wrong; I'm sure someone can help me.

If I feed the RTB with an 800kHz sine, set its FFT to 8kHz centre and 200kHz span. The RTB has 128k FFT points (RTB2004 product brochure V06.00). The scope reports it runs at 2.27MSa/s. If I get Performa01’s calculations right, that means bins of 17.7Hz (*). Using a Flat Top window, I’d expect (on the basis of Performa01 and rf-loop’s posts above) an RBW that is about 3.73 times larger, which would be 66.1Hz. And, indeed, I can set my RTB to a minimal RWB of 66.6Hz, close enough, so all seems right. So far.

Now choosing a Hanning window. The scope still reports it runs at 2.27MSa/s, so the bin size should remain unchanged 17.7Hz, but the window-specific factor for Hanning is around 1.62 (source), so I’d expect an improved RWB of 17.7Hz*1.62=28.7Hz. But, to my surprise, when I try to set the RBW on the scope, the minimum I can set it to is 119Hz (so it's larger instead of smaller than in the Flat Top window scenario). I tried several other scenarios (8kHz sine, 8MHz sine, different span settings), but the results are always different by the same degree. I’m attaching the calculations.

The only possibility that comes to my mind is that the RTB FFT points is not fixed at 128k, but can go to lower values depending on the settings (the window used) and, in the above Hamming window example, would have dropped to simewhere in the range of 32k. But that is pure speculation, I guess it's more likely I am making a mistake in the above. Anyone?

(*) I did those bin size calculations as well for the SDS and they are always exactly as expected.


Offline nctnico

  • Super Contributor
  • ***
  • Posts: 26906
  • Country: nl
    • NCT Developments
It is possible the FFT size varies on the RTB. In recent firmware R&S improved the performance when using low frequencies but I don't know whether 8kHz counts as 'low'. If you use a higher frequency (8MHz for example) I guess (!!!) variable FFT size won't be used. It is worth a try.
There are small lies, big lies and then there is what is on the screen of your oscilloscope.
 

Online Performa01

  • Super Contributor
  • ***
  • Posts: 1642
  • Country: at
For my RTB, I am doing the calculations as posted above by Performa01 and rf-loop, but I’m not getting what I would expect. Probably I’m doing something wrong; I'm sure someone can help me.

I have no idea what's going wrong here, but a few general remarks.

Never forget that there can be two different sample rates: the first one is the sample rate of the scope that depends on its maximum record length, the second one is the FFT sample rate, that depends on the FFT length hence might be further decimated. So it's essential to look at the FFT samplerate, like it's reported by the SDS in the FFT info block and not the sample rate in the timebase tab. I just mention this for completeness as this obviously isn't your problem right now.

The only other thing I can think of is the beauty of the sprectrum analyzer mode, which not only makes things easier for the inexperienced, but might also do some funny and unexpected things behind your back. Such as Keysight who prove unable to provide a valid averaging, but do some additional HiRes unexpectedly and claim it's because they think the users want to reduce noise anyway. (The truth is, that the tiny secondary buffer of just 64 kpts forces decimation and they need to use HiRes in order to avoid aliasing.) I cannot know, but since the FFT in the RTB appears to be somewhat limited in certain regards, you cannot rule out some unexpected tricks behind the scenes to overcome certain limitations.

« Last Edit: July 15, 2022, 06:08:03 pm by Performa01 »
 

Offline RBBVNL9Topic starter

  • Frequent Contributor
  • **
  • Posts: 326
  • Country: nl
Quote
It is possible the FFT size varies on the RTB. In recent firmware R&S improved the performance when using low frequencies but I don't know whether 8kHz counts as 'low'. If you use a higher frequency (8MHz for example) I guess (!!!) variable FFT size won't be used. It is worth a try.

While my regular test was on an 800kHz signal, I also did try an 8Mhz signal, but it did not change anything. Maybe I should go even higher, to find out whether indeed FFT point size varies depending on settings... 

Quote
Never forget that there can be two different dample rates:

Yes, I was aware of this. But as I think you already noted, this does not seem to be the explanation here, because the Flat Top window scenario was 'correct' and the Hanning scenario was 'not correct' (at least, not what I expected). If it was a wrong sample rate used for the calculations, it would have been wrong everywhere.

Quote
So it's essential to look at the FFT samplerate, like it's reported by the SDS in the FFT info block and not the sample rate in the timebase tab.

Well, interesting enough, on my  SDS2000X+ these values are (typically?) the same... When it reads "Sa=40.00MSa/s" in the FFT info block at the top of the screen, I also see "40.0MSa/s" in the grey "timebase" at the bottom. But the calculations I did of  “Frequency interval (△f)” (a.k.a. FFT frequency spacing a.k.a. the "bin-width") were always spot on when I used this sample rate value.
 

Online Performa01

  • Super Contributor
  • ***
  • Posts: 1642
  • Country: at

Quote
So it's essential to look at the FFT samplerate, like it's reported by the SDS in the FFT info block and not the sample rate in the timebase tab.

Well, interesting enough, on my  SDS2000X+ these values are (typically?) the same... When it reads "Sa=40.00MSa/s" in the FFT info block at the top of the screen, I also see "40.0MSa/s" in the grey "timebase" at the bottom. But the calculations I did of  “Frequency interval (△f)” (a.k.a. FFT frequency spacing a.k.a. the "bin-width") were always spot on when I used this sample rate value.

Yes, it's easy enough to predict. When you set the FFT length to its maximum of 2 Mpts, there will be no difference as long as the record length does not exceed 4 Mpts (because 2 Mpts FFT means 2097152 data points, whereas a record length of 2 Mpts would only be 2 million samples, so you need more than that to process a 2 Mpts FFT).

As soon as the record length exceeds the FFT length - either by limiting the FFT size to something small like 64k or selecting slow timebases where the scope needs a lot of memory, the FFT sample rate cannot keep up with the maximum 1/2 GSa/s anymore and decimation will occur.
« Last Edit: July 18, 2022, 04:46:18 am by Performa01 »
 
The following users thanked this post: RBBVNL9

Offline RBBVNL9Topic starter

  • Frequent Contributor
  • **
  • Posts: 326
  • Country: nl
Peter,

Quote
The number of FFT samples is displayed in the Acquire/Acquisition Menu under Record Length.

For all the experiments I did, this number was equal to "131kSa", which equals 128k * 1,024 (wherein the first number, the 'k' is used as in the SI sense, and in the second in the binary sense). So it indeed makes sense that is the number of FFT points.

But since it does not seem to vary in my experiments, it suggests that the number of FFT points is always 128k (at least for the experiments I did), and the speculation that the number of FFT points drops in certain circumstances (at least across my experiments) would be false.

So, I think we l still have not found the explanation for what I seem to see... Fascinating.


Offline RBBVNL9Topic starter

  • Frequent Contributor
  • **
  • Posts: 326
  • Country: nl
Quote
... Maybe I should go even higher, to find out whether indeed FFT point size varies depending on settings... 

Now also tried for a 80MHz sine wave. Still the same thing, the minimal selectable RBW for Hanning window is larger (so less resolution) than for Flat Top windows. Mmm.

And also at 80MHz centre, the record length always remains at 131kSa (=128k FFT points), regardless the chosen window type.
 

Offline 2N3055

  • Super Contributor
  • ***
  • Posts: 6623
  • Country: hr
And I hope now you understand my comment about RTB2000 implementation actually being one that is confusing..
When FFT is rigorously implemented as FFT, you can compare (and repeat calculations on data) between different scopes or even feed raw time domain data to Matlab or some FFT library and verify results. Also, if you have data from some calculations or simulations, you can compare like for like.
It is well known what windows are, how they behave... It takes a bit of learning, but it is good knowledge that is very useful anyways (Fourier transform is one of the really important things to know in what we do, hobby or pro). It very much deepens your understanding of things...

As I said, RTB2000 implementation is a implementation that is made to be simpler to have something displayed on the screen faster and for quick checking it is useful and it is quicker. Nico mentioned GW-Instek, on their MDO series their realtime SA implementation is much superior to what RTB2000 has. Up to 1 Mpoints and very fast and proper implementation of real time SA. It is only 8 bit converter so it cannot get results of the proper SA but very good nevertheless.. But still, like Nico said, the also implemented proper FFT mode, for when you need real FFT....

 
The following users thanked this post: Markus2801A


Share me

Digg  Facebook  SlashDot  Delicious  Technorati  Twitter  Google  Yahoo
Smf