Author Topic: Impedance Measurement Using a Current Probe and Siglent Bode Plot II  (Read 1648 times)

0 Members and 1 Guest are viewing this topic.

Offline graybeardTopic starter

  • Frequent Contributor
  • **
  • Posts: 431
  • Country: us
  • Consulting III-V RF/mixed signal/device engineer
    • Chris Grossman
This video demonstrates how to measure impedance from 10Hz to 10MHz using a Tektronix P6042 Current Probe, Siglent SDS1104X-E Oscilloscope with Bode Plot II, and a Siglent SDG2042X function generator.  I show examples of impedance plots of resistors, inductors, speakers, and standard and polarized capacitors.  The results are good from 10Hz through 1MHz and usable to 10Mhz.


You can download a copy of the charts and example EXCEL files here

I hope you enjoy this.
Chris
« Last Edit: June 23, 2019, 09:19:08 am by graybeard »
 
The following users thanked this post: BravoV, Performa01, thm_w, BillB, core

Offline Chriss

  • Frequent Contributor
  • **
  • Posts: 534
  • Country: 00
Re: Impedance Measurement Using a Current Probe and Siglent Bode Plot II
« Reply #1 on: June 23, 2019, 10:05:06 am »
Thank you for this nice video and post.
I really like it.

My best regards.
Chris.

Sent from my SM-J500F using Tapatalk

 
The following users thanked this post: graybeard

Offline graybeardTopic starter

  • Frequent Contributor
  • **
  • Posts: 431
  • Country: us
  • Consulting III-V RF/mixed signal/device engineer
    • Chris Grossman
Panasonic 0.22µF polyester capacitor impednace measurment example
« Reply #2 on: June 24, 2019, 04:47:25 pm »
Here is an example impedance curve I measured using the set-up described in the video.


This is the label on the 41 year old bag of capacitors:
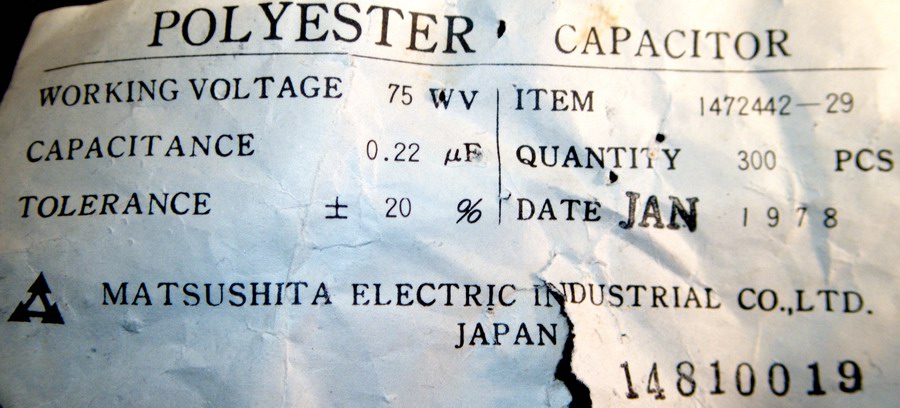


This is the capacitor being measured.  You can see the oscilloscope probe connected closest to the device and the force leads at the lead tips.
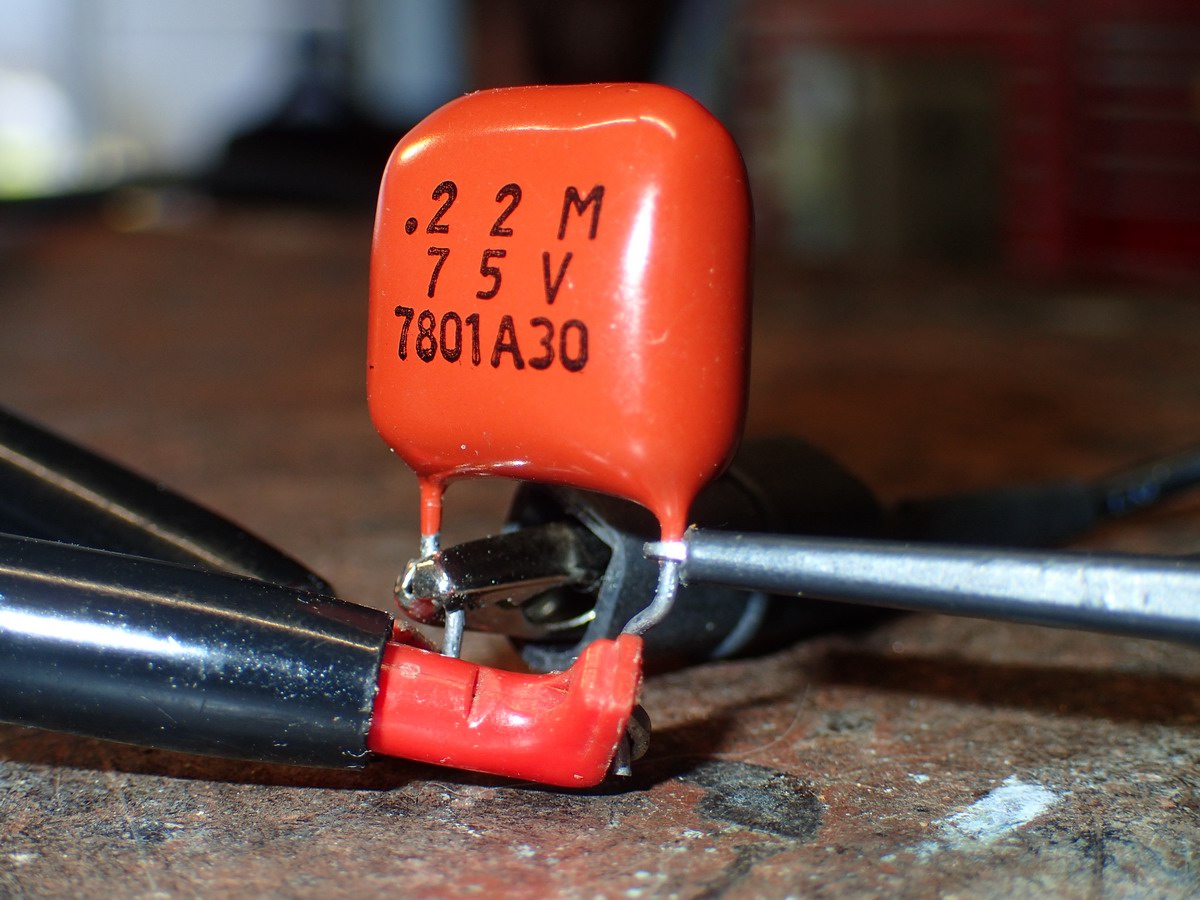


This is the capacitor impedance curve showing a self resonance frequency of 700KHz.
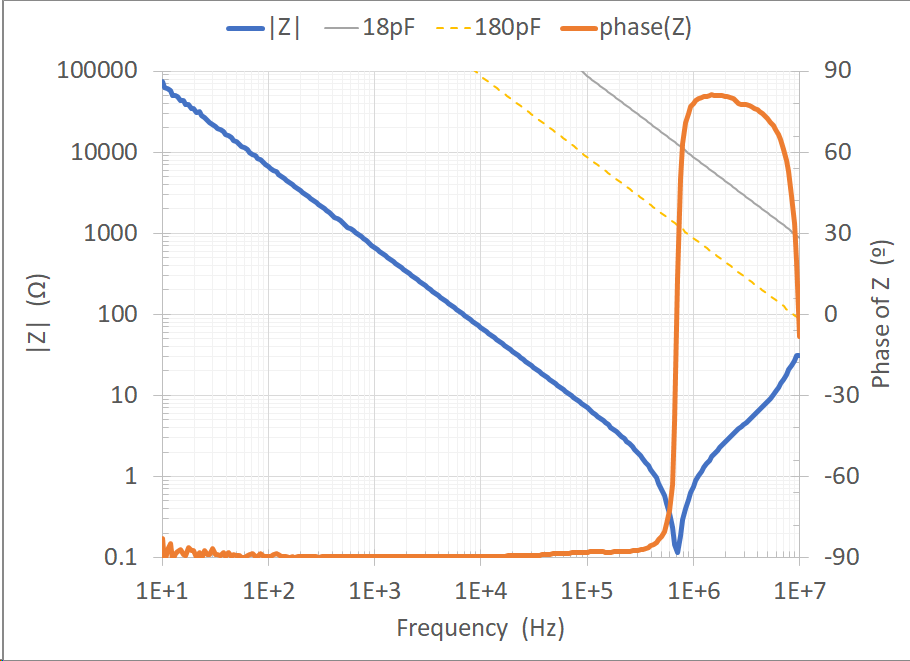


These are the series R, L, and C values calculated at each frequency from |Z| and phase(Z).
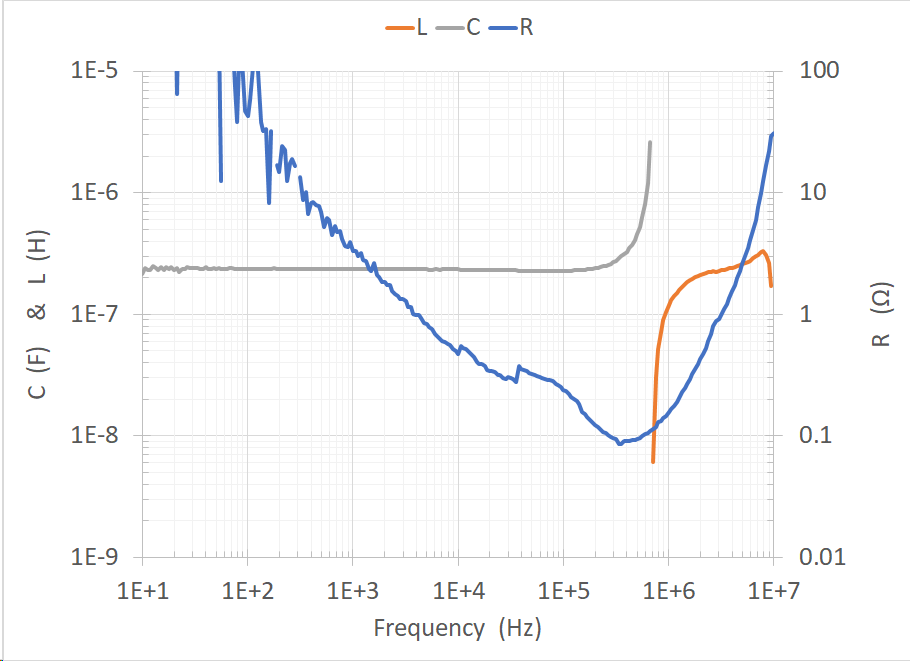
It shows the measured capacitance is the nominal 0.22µF.  The ESR at resonance is ≅0.12Ω which matches the minimum of the |Z| curve.  The ESL is ≅220nH which is the same value you would get from calculating it from the resonance.

Chris
« Last Edit: June 24, 2019, 09:17:26 pm by graybeard »


Share me

Digg  Facebook  SlashDot  Delicious  Technorati  Twitter  Google  Yahoo
Smf