This is good information. Here is what I see. For most of this time span, the voltage is rising despite what is happening with temperature. At around 08:00, the voltage is stable. After stability is reached, the zener voltage responds to temperature change in the opposite direction of the temperature change.
This long time to warm up is what I have seen operating the device in its intended configuration. If the device is operated at a temperature much higher than ambient, then the warmup time should be eliminated.
At 1.4mA the dissipation is only 7mW, so not much to warm up with. The temperature readings are not for the zener itself, but for the enclosure, that might explain the discrepancies. I will try next time to log the voltage on the second zener in a diode connection, that would give a very good tracking of the actual zener temperature.
Cheers
Alex
I do not see any discrepancies. I see the zener voltage rising to some asymptotic voltage despite any ups and downs of temperature. If this is not "warm up" then it is some other march toward some sort of equilibrium that appears to be achieved at 08:00 where temperature is flat and voltage is flat. During that flat time, zener voltage and temperature appear to be at equilibrium.
I do not see any discrepancies. I see the zener voltage rising to some asymptotic voltage despite any ups and downs of temperature. If this is not "warm up" then it is some other march toward some sort of equilibrium that appears to be achieved at 08:00 where temperature is flat and voltage is flat. During that flat time, zener voltage and temperature appear to be at equilibrium.
Hmm, what I see is that the temperature is steadily falling (with some variations on the temperature sensor which may not necessarily affect the zener - as I've said, the temperature sensor is not in a direct contact with the zener). More important for me is the fact that the voltage comes back to exactly the same value at the end of the run at 25C as it was at the very beginning (less than 1ppm difference).
Cheers
Alex
Alex,
Could you post the raw figures for that run please? I'd like to run some statistics on them.
Here. It includes several step changes in the current at the very beginning which I've cut off of the uploaded graph. Steps in the resistor value are 3.449K, 3.448K, 3.446K and 3.447K (at that value the main overnight test was run).
Cheers
Alex
For thermal mass, this defective press in triac jumped out of the junkbox. Dug out the old part and potted it in this 3/4 inch slug.
Large nut would also work.
Using the same sample as I was using yesterday (the 20mA run), I am seeing the same stable point as Alex for the Zener alone... 1.4mA, 5.251V. This appears to be another turnover point: Negative TC below, Positive TC above. My sample seems to hold within about 20uV over a range between 20-24'C.
I guess the two turnover points make some kind of sense, the higher the current the more positive the TC of the zener becomes until it matches the negative TC of the diode, but not until about 20mA. Much higher than the expected 5 - 7.5mA. Below 20mA it seems that the positive TC slope of the zener is too low. [Edit:] I'm assuming that the TC of the diode will remain pretty much -0.6mV/'C regardless of current.
A solution (if achieving lower noise than at 1.4mA operation is a priority) may be to add a divided down portion of the diode forward drop to the zener voltage. Maybe this could be done by biasing the diode separately and using passive divider?
One other thing. Has anyone else noticed that the leads seem to be made of rather stiff grade magnetic steel? I've avoided risking my good cutters on them but even my carbide ones take a bit of force. There also seems to be a bit of crazing on the glass to metal seals of most samples, possibly due to the lead length and stiffness. I think they will need mounting with care to avoid stresses.
[Edit:] I'm assuming that the TC of the diode will remain pretty much -0.6mV/'C regardless of current.
Isn't it -2.2 ... -2.5mV/C ?
Cheers
Alex
Oops!

Can't think now why that figure is sticking in my (somewhat defective) head!
For most cases I would prefer the 1.4 mA operation point. The noise already seems to be low (e.g. much better than an LM329 or LM399), possibly at the level an LTZ1000 would get at 5 mA. If you really care, just use 2 in parallel or series - not that expensive and still low power.
Also the 5.25 V level could be a big plus if one wants to scale to 5 V (or 10 V starting from 2 diodes in series).
Adding only a part of the diode drop should work to get a different operating point (higher current) for compensation. I don't even think one would need separate biasing - just a divider to get something like half the diode voltage.
True, if it performs so well at low current there really isn't any need to go higher.
Adding only a part of the diode drop should work to get a different operating point (higher current) for compensation. I don't even think one would need separate biasing - just a divider to get something like half the diode voltage.
Actually, yes, it is that simple isn't it, I was over-thinking it. Correcting by balancing a Positive TC with an adjustable negative TC (assuming relatively flat profiles) just
feels a little more comfortable than relying on the TC turnover point of the zener alone, at least both slopes are going in predictable directions. Maybe this has the possibility of yielding a lower overall TC over a wider temperature range, it might on the other hand be needless (drift introducing) added complexity. It seems worth a try though.
For some reason I'm having problems with file uploads to the forum today; so you're not going to get any charts.
I've taken a look at the figures Alex kindly uploaded. Doing a linear regression of voltage against temperature gives a tempco of -24.3 ppm/C with a correlation coefficient (R2) of 0.76 which is a fairly strong correlation. On a scatter plot there are 3 islands of outliers, all well away from the main line. The scatter plot suggests that relatively there's a lot of noise in the temperature readings.
@Cerebus
If I look at the graph from previous page I would say that an app. 5.25V reference level and app. -60uV (min/max) in 2.5C (min/max) would make app -5 to -6 ppm/C (as Alex already said).
Why don't your numbers come close to that?
If this is quite good lineair, as you also say, then the TC could be indeed nicely compensated, like Giro proposes by a divider like this one (with different numbers) of Zlymex:
https://www.eevblog.com/forum/metrology/spread-sheet-aided-design-of-compensation-for-7v-to-10v-step-up-resistor-set/
I didn't imply anything about the linearity. Are you perhaps confused by the mention of a
linear regression? I'm not saying that the tempco is
X, just that
X is what pops out of a linear regression of this narrow temperature range. A linear regression seems reasonable (as opposed to other curve fits) as, for the small temperature span in Alex's figures, the curve is quite linear - over a wider temperature I'd expect it to be more polynomial in nature. The disparity from more empirically arrived at figures is in part the small range and in part the sheer amount of noise in the temperature data - the latter makes it difficult to really see what's going on, precisely why I wanted to try some numerical methods. I wish I could fix my uploading problem as the scatter diagram is quite informative, there's a lot of smearing across temperature but there's also a very clear central trend. It might be beginning to flatten out at lower temperatures but, again, the noise in the temperature data makes that unclear.
I actually spent the evening hacking about some foam, a peltier device, a couple of heatsinks, a thermocouple, a breadboard and a ZIF socket, to see if I could come up with a fixture that makes for a more controlled testing environment - I'm perhaps 20% of the way there.
Here is a graph of many hours overnight at 6mA mounted to a copper bar on the front of a KE2461. The graph starts during the day when the sun is shining into my office/lab. This device appears to be a candidate as a temperature sensor.
For some reason I'm having problems with file uploads to the forum today; so you're not going to get any charts.
I've taken a look at the figures Alex kindly uploaded. Doing a linear regression of voltage against temperature gives a tempco of -24.3 ppm/C with a correlation coefficient (R2) of 0.76 which is a fairly strong correlation. On a scatter plot there are 3 islands of outliers, all well away from the main line. The scatter plot suggests that relatively there's a lot of noise in the temperature readings.
Is it -24.3 ppm/C or -24.3 uV/C (which is about -5ppm/C)?
Cheers
Alex
It's just the
m in
y = mx + c, where y is volts and x is Celsius so, yes, it's effectively uV/C. Sorry, I should have been clearer but it was getting late here.
Here is a graph of many hours overnight at 6mA mounted to a copper bar on the front of a KE2461. The graph starts during the day when the sun is shining into my office/lab. This device appears to be a candidate as a temperature sensor.
At 6 mA the TC of the zener is supposed to about compensate with the TC of the normal diode. So no wonder you get a lot of sensitivity to temperature variations with just the zener, should be somewhere in the +1-2mV/K range. So the 160 µV of voltage change would correspond to something like 0.1-0.2 K.
There should be no need for an external compensation of the linear TC. It should be possible to to find an operating current where the linear TC tends towards zero for a given temperature. There even seem to be two such current settings. One low (e.g. 1mA range) for just the zener and one rather high (e.g. 10 mA, but could be 5-20 mA depending on sample) for the series configuration. It just seems to be a little tricky to find one of those points, especially the one at higher current.
The 5 ppm/K (at 1.4 mA) is already a useful value / not that bad. To get a rough idea one would need TC data for a few different currents - to get an idea on how accurate one should find that ideal current. The curves with an external temperature sensor are not that accurate - so it would be really preferred to use the internal diode as a temperature sensor - at least for relative changes.
It is being operated with both diodes in series. Looking for the current that produces the least swings in voltage for ambient temperature in my office/lab.
For both diodes in series and 6mA current the voltage is very low!
Cheers
Alex
I've been playing around with the divider approach today and it looks as if it is possible to achieve very low TC values over a limited temperature range even with a simple hook up. I've attached the schematic for clarity but it's basically just taking the output voltage from a divider tap across the forward biased diode. I simply used a 2k cermet preset, it took a little tweaking but it looks as if the flat portion of the TC curve can be adjusted to any temperature and operating current, in this case about 23'C and is very flat over a few degrees. TC is sensitive to both divider ratio and supply current as you would expect.
Operating the device at 5.010mA with the divider (pot) measuring 765R / 1k3 the output of my sample is 5.878V Temperature profile came out as follows (values relative to 23'C case temperature):
20'C -12uV
20.5'C -4uV
21'C -3uV
21.5'C -2uV
22'C -1uV
22.5'C 0
23'C 0
23.5'C -1uV
24'C -5uV
24.5'C -7uV
25'C -14uV
Temperatures were measured during device warm-up (it finally settled at about 25.3'C) using a thermocouple taped to the side of the can. I was using a Geller SVR-T and Muirhead decade divider with Datron 1041M, null meter style. I repeated 3 times, each warm-up taking less than 5 mins, with consistent results (obviously the readings were a bit noisy at this level).
It is being operated with both diodes in series. Looking for the current that produces the least swings in voltage for ambient temperature in my office/lab.
For both diodes in series and 6mA current the voltage is very low!
Cheers
Alex
Pilot error. I grabbed the wrong one. i have 4 of these mounted to banana plugs. One is wired for just the one diode. Arrrggghhh
I've been playing around with the divider approach today and it looks as if it is possible to achieve very low TC values over a limited temperature range even with a simple hook up. I've attached the schematic for clarity but it's basically just taking the output voltage from a divider tap across the forward biased diode. I simply used a 2k cermet preset, it took a little tweaking but it looks as if the flat portion of the TC curve can be adjusted to any temperature and operating current, in this case about 23'C and is very flat over a few degrees. TC is sensitive to both divider ratio and supply current as you would expect.
Operating the device at 5.010mA with the divider (pot) measuring 765R / 1k3 the output of my sample is 5.878V Temperature profile came out as follows (values relative to 23'C case temperature):
20'C -12uV
20.5'C -4uV
21'C -3uV
21.5'C -2uV
22'C -1uV
22.5'C 0
23'C 0
23.5'C -1uV
24'C -5uV
24.5'C -7uV
25'C -14uV
Temperatures were measured during device warm-up (it finally settled at about 25.3'C) using a thermocouple taped to the side of the can. I was using a Geller SVR-T and Muirhead decade divider with Datron 1041M, null meter style. I repeated 3 times, each warm-up taking less than 5 mins, with consistent results (obviously the readings were a bit noisy at this level).
It's now 5 hours later... The room has cooled a couple of degrees so the package temperature has dropped to 23.7'C. The voltage is now +3uV from the previous 23.5'C value (+7uV from the previous 24'C value). Operating current is still sitting at 5.010mA and there has been plenty of time for any thermocouple effects to stabilise.
It probably says as much about the SVR-T's TC and the Muirhead's ratio stability as it does about the sample but that's pleasingly close. Either that or everything is drifting rather conveniently in the same direction. Surprising though.

EDIT: Probably happy chance above. One hour later, case temperature is now 22.9'C and voltage -6uV vs previous 23'C reading. Room temperature has dropped quite fast now the heating has gone off though, so the higher thermal mass items probably aren't keeping pace. I'm off the edge of my measurement capability here.
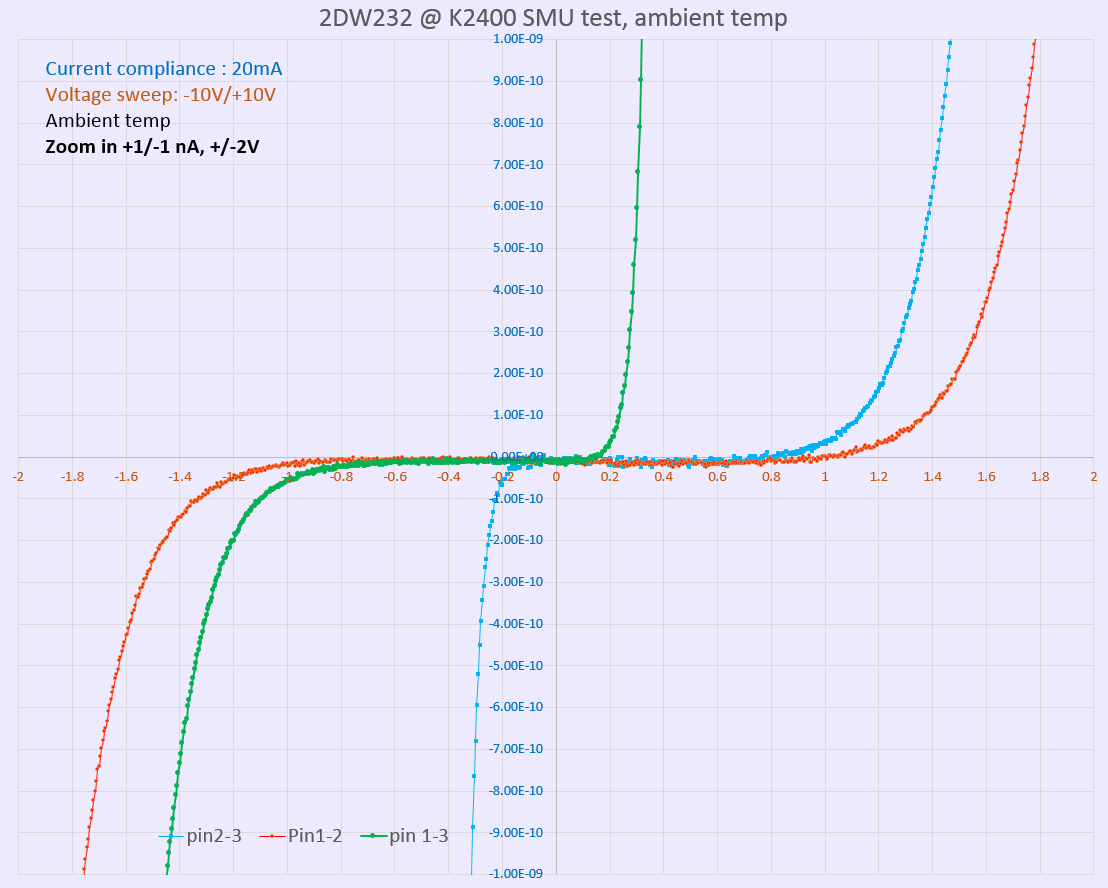
First candy test. Nothing fancy, just K2400 run with help of
little snake.
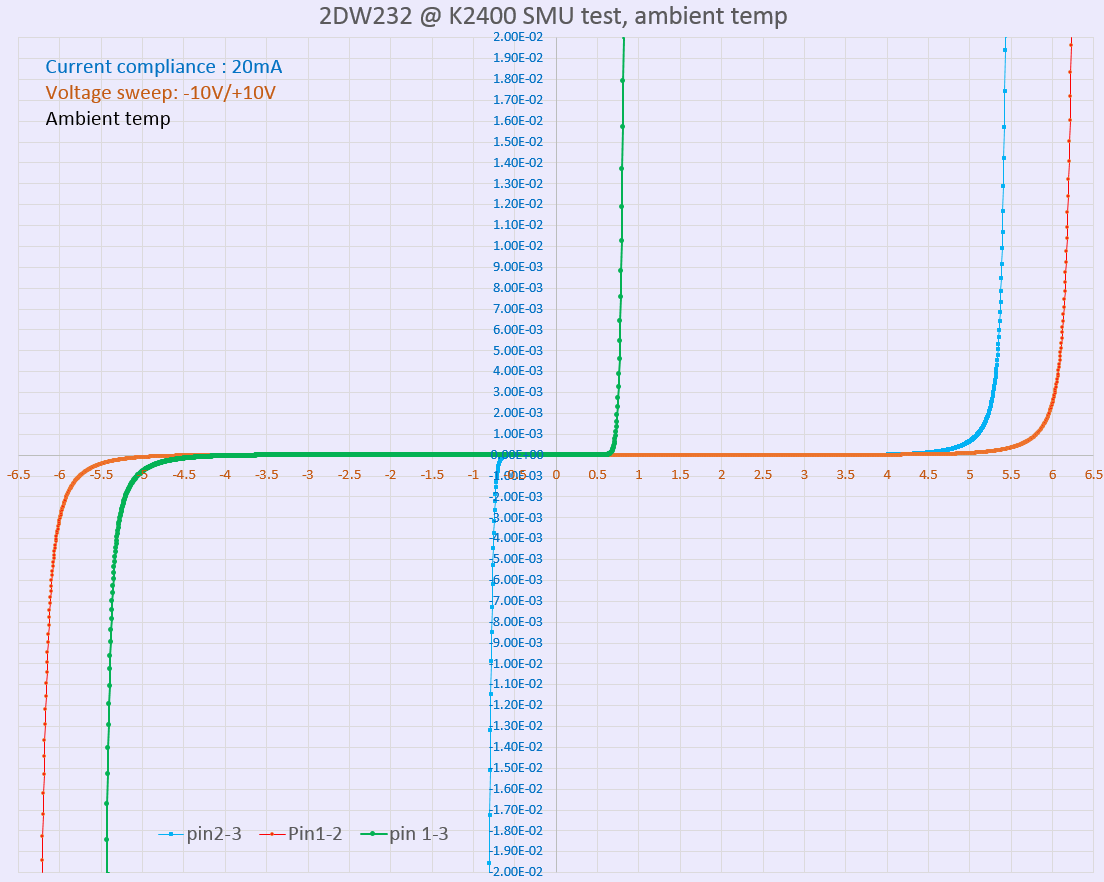
Blue line - pin2-pin3 junction
Orange line - pin1-pin2 junction
Voltage sourced -10 to +10V, current compliance 20mADC
DATA 1 (XLS)DATA 2 (XLS)
Yea, correct.
I'll have to try pin 1-3 too

Zoom in region +/-1nA :