The internet is full of posts from people tearing their hair out trying to use this tool

I have it running OK although 99% of it is a mystery. And the code which the configurator generates is crap

With the old ICEs one could do a bar graph easily, across the address range, and then you could zoom in.
Obviously there is no identical way to do this because the 32F runs code fully internally, so the only way is with a temporary breakpoint, cancelling it as fast as the debugger is capable of (probably still takes milliseconds) and moving it to the next address, the next C source line probably.
There are many other ways to trace the code on ARM. What methods are supported by the hardware depends on the device. What methods are supported by the IDE/Debugger depends on that IDE/Debugger.
Segger's Ozone software in combination with a J-Trace probe can do this live, in real time, with zero software changes. Since Ozone works from the application .elf file it doesn't just track execution over the binary application, it resolves to individual functions and provides code coverage as well as execution time statistics that all update in real time. It does require using the trace signals (TRACED0-TRACED3 & TRACECK), and depending on your platform you might not be able to run at full speed, but it's pretty powerful otherwise. (You may also need to throttle down if you didn't include the trace connections on the board and had to bodge them out later

)
https://www.segger.com/products/development-tools/ozone-j-link-debugger/technology/trace-features/Whether that's worth the ~$2k price tag of a J-Trace to you or not I can't say. I guess that's not bad compared to how much a lot of the old ICE systems cost. I'm not sure if there's an OSS/low cost alternative. I know someone who was considering making a project out of it but I don't think he's made any progress on it.
You need a lot of bandwidth to do instruction tracing of high speed parts. swd or swo just doesn't cut it. One of the best tricks around is to profile how much idle task cpu time you have when using an RTOS with a digital output.
Set the digital output to be high when leaving the idle task and low when entering. Then you can look with a logic analyser and see the exact cpu usage by looking at the duty cycle.
Well. STM32 Cube IDE uses gcc and gdb to talk to ARM. None of those is specific to ST.
So if either of those can, then you can add it to eclipse.
Problem is the high bandwidth, Keil also can't do it with an ST-Link, but you can do
exception tracing. For more you really need an ULINK, preferably a pro. And then your board needs the wiring for it.
Quick search delivered this:
https://mcuoneclipse.com/2015/08/23/tutorial-using-gnu-profiling-gprof-with-arm-cortex-m/But you can also do it in software using the DWT->CYCCNT and a table. Has some overhead though.
In principle it should be possible by setting breakpoints at random (or sequential) addresses, immediately cancelling each one.
It would slow the target down a bit but not too much.
Traverse the address space for an hour...
One issue I see is that you have only a limited number of breakpoints, and you would quickly waste them on addresses which never get visited. So you would have to set one, hang around a bit, then clear it.
Does setting a breakpoint which doesn't get hit slow down the target?
The old ICEs were pricey for sure; I paud GBP 5k in 1985 for a Z180 one. But it was amazing. We managed to squeeze far more speed out of the chip, much of it by replacing specific IAR runtime code with assembler routines
Sometimes we got a 100x speedup, although to be fair in retrospect one could guess where.
What is your actual device?
Even on the most primitive devices with no debug capabilities at all, you can always collect statistics by sampling the PC with a timer interrupt. Obviously interrupts are intrusive, but the timer interval can be quite long if you don't mind waiting for the statistics to be collected.
Breakpoints that do not get hit cost nothing. Breakpoints that do hit are expensive.
32F417.
Yes, very true about sampling on a timer int. Not difficult to set up an array and then increment elements in it if hit.
This device had all the trace featured ARM offers for microcontrollers.
With ITM (instrumentation trace macrocell) you can get periodic PC samples without affecting the system performance. ETM stream is sent to SWO pin, which can be received by many cheap tools.
With ETM (Embedded Trace Macrocell) you can know what MCU was doing cycle by cycle (with some exceptions of trace port overflow). But this information is sent over a separate trace port (4 data pins + clock) and this port is very fast (~core clock) and can only be received by special and expensive tools.
Generally I find ETM to be not very useful in real life for debugging. It may be more useful for profiling, I don't know, never needed to do that.
And finally, in practice, often just reading SYSTICK or some other timer in beginning and end of interesting/critical ISRs or processing functions (often less than handful of those) then saving min/max/avg times in variables and dump those out is not much work and almost non-intrusive (or explicitly, predictably and repeatably intrusive). Clear benefit is this can be done "on field" or "in production" and communicated out using whatever communication the MCU has to the outside world already, making it unnecessary to bring the unit to the lab table, connect the probe and try to reproduce the behavior.
If you’re using FreeRTOS, it also has a build in profiler that you can enable but it is at the Task level instead of function level. there is an eclipse plugin that can view everything from the IDE. I’ve only used it with NXP parts and MCUXpresso but should be similar for STM32CubeIDE since they are both eclipse based.
I've been using the ITM data console (very fast) and have just found the other ITM output stuff, and the FreeRTOS task display - thank you very much. The task display doesn't update in real time and doesn't show the % time. I did see a video somewhere showing a horizontal display of RTOS activity but can't find it now; may have been a different IDE.
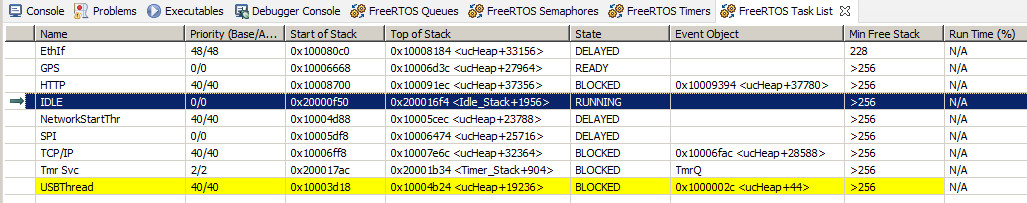
The % should show in real time, if not, it’s probably not configured correctly. You need to enable it in the configuration and hook in an independent timer running at 10-100x the tick rate to use as a sampler. This website has some documentation and example.
https://www.freertos.org/rtos-run-time-stats.html
I once wrote a pretty simplistic library for debugging Atmel AVR's.
I had a bunch of macro's that inserted bit set and bit clear instructions to output 5-bit codes on an I/O pin and these could be easily caught by a USD10 Logic Analyzer and Sigrok / Pulseview.
To follow the code it was not necessary to insert such macros after each instruction or even each C statement. I just had them in each If() statement, loop and in some important ISR's.
This worked quite nice. With just one logic analyzer channel I could correlate code with other events, and the LA catches a back log so you can examine what happened before you got into some bug.