This also refers a bit
https://www.eevblog.com/forum/microcontrollers/10-pin-debug-connector-and-stlink-v3-isol-not-reliable/I have been investigating why most (not all) STLINK V3 debuggers are persistently unreliable, in the SWO feature, which they call SWV ITM debug. It is a high speed UART which comes out on the SWO pin of the SWD interface.
On a scope, I see the data coming out on the SWO pin going
into the debugger, so it is apparently nothing to do with the source code. The first mystery is that in all the ST example code there is no config for this feature. So initially I thought they just rely on power-up register values.
As regards Cube IDE config for this, the debugger config (under Project Properties Debug etc) looks like this, and one can control the SWO speed so e.g. this
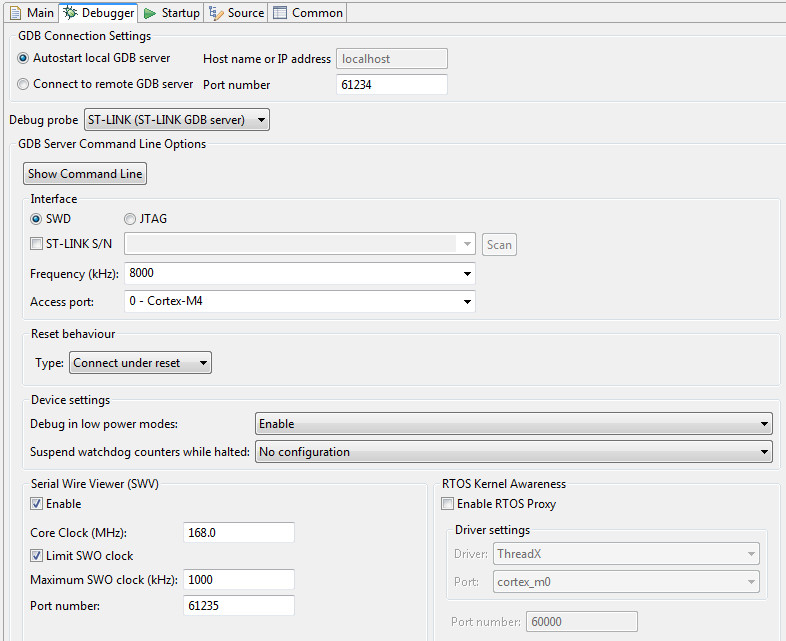
produces 1MHz. One can check this with a scope.
But still Cube IDE shows no data, even though the scope shows the bits 1us wide. So I wondered if the UART has the right config...
This led me to wondering whether there is a specific init to be done in the CPU. No STM code I have seen configures the SWO output. The output function is just this
/*
 * Copied here from core_cm4.h.
  \brief   ITM Send Character
  \details Transmits a character via the ITM channel 0, and
           \li Just returns when no debugger is connected that has booked the output.
           \li Is blocking when a debugger is connected, but the previous character sent has not been transmitted.
  \param [in]     ch  Character to transmit.
 */

static void ITM_SendChar_2 (uint32_t ch)
{
  if (((ITM->TCR & ITM_TCR_ITMENA_Msk) != 0UL) &&      /* ITM enabled */
      ((ITM->TER & 1UL               ) != 0UL)   )     /* ITM Port #0 enabled */
  {
    while (ITM->PORT[0U].u32 == 0UL)
    {
      __NOP();
    }
    ITM->PORT[0U].u8 = (uint8_t)ch;
  }
  return;
}
So they are enabling the output for every char. And this is old code, used by many.
So I wondered whether there is something deeper going on which is producing the data in a format which the debugger+Cube cannot parse. Googling around, one finds this code
// Enable debug clocks in RCC
void SWO_Init(void)
{
    // Enable DBGMCU clock (usually already enabled)
    // Enable trace and debug blocks
    CoreDebug->DEMCR |= CoreDebug_DEMCR_TRCENA_Msk;

    // Get current system clock frequency
    uint32_t sysclk = SystemCoreClock;

    // Configure SWO prescaler for desired baud rate
    // For example, for 2 MHz SWO clock from 168 MHz system clock:
    // Prescaler = (SYSCLK / SWO_FREQ) - 1
    uint32_t swo_freq = 2000000; // 2 MHz
    uint32_t prescaler = (sysclk / swo_freq) - 1;

    // Configure TPIU (Trace Port Interface Unit)
    TPI->ACPR = prescaler;

    // Set protocol to NRZ (UART-like)
    TPI->SPPR = 2; // 2 = NRZ/UART mode

    // Disable formatter
    TPI->FFCR = 0x00;

    // Unlock ITM (Instrumentation Trace Macrocell)
    ITM->LAR = 0xC5ACCE55;

    // Enable ITM
    ITM->TCR = (1 << ITM_TCR_ITMENA_Pos) |  // Enable ITM
               (1 << ITM_TCR_SYNCENA_Pos) | // Enable sync packets
               (1 << ITM_TCR_TraceBusID_Pos); // Trace bus ID = 1

    // Enable stimulus ports (channels 0-31)
    ITM->TER = 0xFFFFFFFF; // Enable all 32 channels

    // Configure DWT (Data Watchpoint and Trace)
    DWT->CTRL = 0;
}
which does not help, perhaps because the SWO clock is now 100kHz

Why 100kHz? No idea. Probably because the trace macrocell runs off the APB1 and not the 168MHz clock. But looking up the trace macrocell registers in the RM, I see this
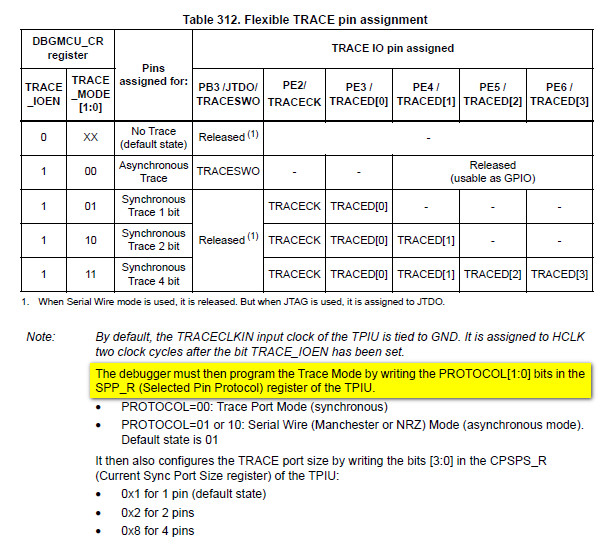
so the
debugger actually sets up all this, by writing into the relevant CPU registers! So no wonder that ST do not provide SWO setup code in their code examples...
As to what data the debugger is then looking for in the way of data format, I can't find this but since there is no clock signal coming out, I would expect SWO to be straight NRZ like RS232.
This whole thing is a mess. Fairly obviously, if you include any code to configure this SWO feature, that will execute
after the debugger has configured it, so now Cube needs to be configured to match your
software config.
Now I am seeing something else: continuous data on SWO. A packet of data every 95us. No idea where that is coming from. The data, if NRZ, is inverted i.e. normally 1, which is what a UART inside a CPU normally emits. And this remains after I have reverted back to the previous code. Given that this trace macrocell is set up by the debugger, probably that is where the problem is.
Obviously I've tried different STLINKs; both the V3 ISOL in a plastic box and the tiny 40x15mm PCB version with a USB-C connector. SWV ITM debugs are dead on all of these.
A quick google seems to agree with my above hypothesis:
Yes, STLINK debuggers configure STM32F4 target registers, including the ITM (Instruction Trace Macrocell) for Serial Wire Output (SWO) trace, by writing to ITM/TPIU registers through the SWD or JTAG interface. This allows developers to use software like STM32CubeIDE or Keil MDK to enable SWO output, view debug information from the Instrumentation Trace Macrocell, and visualize it in a terminal. This topic also relates to an old question: can you use the SWO debug output with a target that does not have a debugger attached? Obviously this will not work. In such a case you must include the code to set it all up. Like here
https://community.st.com/t5/stm32-mcus-boards-and-hardware/how-to-enable-swo-with-st-link-utility-on-stm32f407g-disc1/td-p/228896https://gist.github.com/mofosyne/178ad947fdff0f357eb0e03a42bcef5cBut the last one above is still using a debugger of some sort because he is sending out OpenOCD commands to it.
However, the post by Nikita91 here
https://community.st.com/t5/stm32-mcus-boards-and-hardware/how-to-enable-swo-with-st-link-utility-on-stm32f407g-disc1/td-p/228896suggests that it will still not work until enabled by the debugger! That code looks closest to something which might work though.
Also he is missing the code to set PB3 to an output. That code appears in the mofosyne code above.

 Home
Home Help
Help Search
 Login
Login Register


