I received the Agilent 54622A that I just bought. What a neat little scope! It has some of the goodies of a digital scope but all of the ease-of-use of an analog scope. (There is a question about FFT settings down below--skip to that bit if you like.)
I've removed the front panel and gave the encoders a good bath. The only one that was really dodgy was the time-base encoder for Channel 2, but I cleaned them all. The scope was spotless on the inside, and I found a sticker that identified it as being the property of South Dakota State University, so it was apparently an EE lab device. The encoders looked sealed, but they have a gap to the internals right under the emerging PCB that holds the solder leads, and it's easy to inject IPA into that area to flush out dust. I used IPA rather than DeOxit, because these are optical encoders and the object is to be clean. I then put just a drop of clock oil on the shafts to lubricate the rotation. I also cleaned all the gold pads under the pushbuttons (though they were already clean and reliably functional) and cleaned the carbon pads on the buttons themselves with a Q-tip and IPA. All works perfectly now. I'm leaving it open for the moment until I source a replacement for the PCB battery, and until I fire up the lathe and machine a replacement shaft for the intensity control. (The knob for that was broken off and rolling around in the bottom of the box--very typical of these scopes.)
Everything works perfectly and the scope passes all its self tests without comment (except that I did not hook up a printer).
I spent a good couple of hours working my way through the FFT function. Here's what I found:
1. The noise floor in default mode is about -60 dB, which is no bueno. But the scope supports high-resolution mode, which with the firmware revision this scope has (dated 2001), is the product of which time scale one selects on the horizontal control knob, which in turn affects the sampling rate. To get the sampling rate to its highest 200MS/s, one must select a time base (i.e. >200uS) that allows 100 KHz of displayed bandwidth--it selects the sampling rate based on the Nyquist frequency. When I adjusted the FFT span to 20 KHz (typical for some audio applications), I get a 40 mS/s sampling rate. That's 2000 points--it's standard window for FFT.
2. In addition to this, one needs to apply averaging, which is on the acquisition menu. Even with a sample rate of 1 (which applies smoothing), the noise floor will drop at least 30 dB. To get the full 12-bit resolution in addition to that, set the average to 256 samples and the highest sampling rate. That slows the display down quite a bit but it's completely usable for measuring steady-state signals.
3. Here's where I started to get confused. Once the display noise floor was down below about -90 dB, or averaging about -100 dB (which requires changing the vertical scale to 20 dB per division), I noticed a range of harmonic distortion.
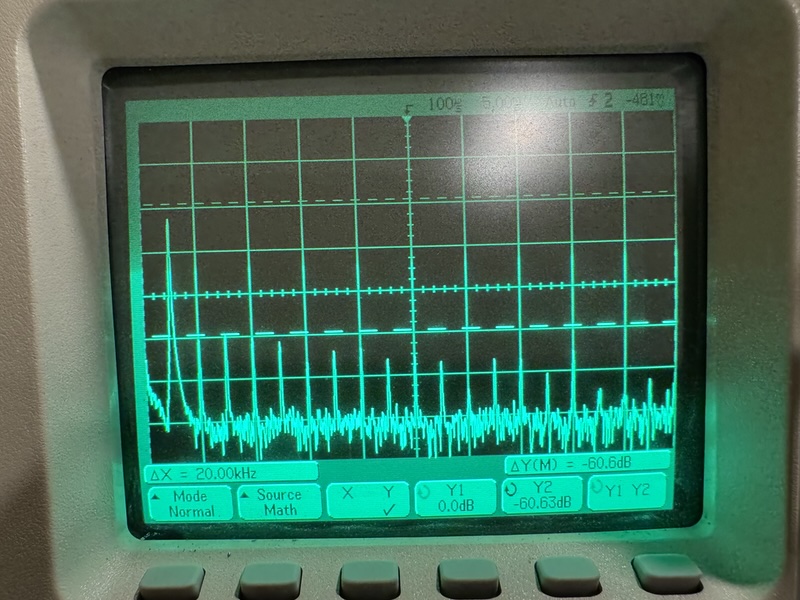
The display spans 20KHz, 20 dB per division, and the 1KHz test signal is from the oscillator of my HP 8903b distortion analyzer. The 8903 believes that signal to have a SINAD of -96.49 dB, but I'm seeing harmonic peaks at -60 dB in this display (with a full-scale signal at -7 dB). The 8903 is set to 1V output, but with a source impedance of 600 ohms. I get accurate voltage displays on the scope when I use a 600-ohm terminator, but no other difference in the display--still about -55 dB from signal peak to harmonic peak). The voltage reads low with a plain coax/BNC cable connection, which probably has a nominal impedance of 50 ohms. I have the horizontal time reference set to 100 uS, which is 5mS per division. That gives me 50 full waveforms on the trace display, with the vertical voltage range set to nearly (but not quite) fill the screen vertically. The display is also showing an integral number of waveforms on the trace display.
Just to confirm that the 8903 wasn't a little too impressed with itself, I switched the source oscillator to my Tektronix CFG250, which specifies 1% THD. The 8903 measured it at -45 dB SINAD, which is right on spec. The scope also showed the harmonic peaks to be right around -45 dB from the signal peak, which indicates agreement. But as soon as the signal quality of the source improved to better than -60 dB THD, those overtone peaks just never got any smaller.
I realize that asking a scope to produce a sensitive FFT is asking a cat to do a dog's job (the dog being a proper spectrum analyzer). But it seems like something must be making those peaks. Could that be the signal amplifiers in the scope revealing themselves?
(Yes, I know I can use the notched "monitor" output of the 8903 to just look at the harmonics, with substantial amplification.)
Conclusion: The UI of the 54622 is that perfect blend between features and complexity, it seems to me. My Tektronix T934 has all the basic controls of an analog scope, but no math functions and no storage. My Rigol DHO804 has all the features one wants in a modern scope, but some of those features require so much touch-screen activity that it's more annoyance than usefulness. I have fat fingers and large hands, and the screen is too small for all that touch control. I find I have to hold the Rigol in my left hand so that I can read the screen and manipulate it with my right hand. It's easy to hold, but that's not the point. I am going to put a touch-screen monitor on at some point, which I think will address those issues. The Agilent has the features I really like that are only two or three button presses away, and all the buttons are tactile. In the general contention between features and UI complexity, the Agilent is much closer to where I am.
Rick "loving it but dreaming that the FFT might show distortion products down to the noise floor" Denney

 Home
Home Help
Help Search
 Login
Login Register


 Topic: Test Equipment Anonymous (TEA) group therapy thread (Read 35422437 times)

