Put a HP 3478 multimeter on the probe test points of the Rigol 2072,
got 1.48 V on DC
got 1.48 V on AC
On the Rigol 2072,
got rms 1.48 on AC
got rms 2.08 on DC which is not correct
rms gives same Power in the same R, as a DC voltage of that value.
Thought so at start too. I.e. that the Rigol is not correct in that case. Your scope and DMM show exactly the same values as my gear. But I saw in square waves theory that a unipolar square wave with 50% duty cycle should have an RMS value of 0.707 times its full height voltage value (VRMSpulse=VpSqrtDuty). Maybe its just a matter of DMMs can't differentiate unipolar from bipolar squares, when the scope can see the difference when DC coupled? Can anybody run the same test in another brand DSO to compare behavior? Thanks.
Be aware that Gating Area, means the trace on the display, so you can see when I moved the trigger point to the left and adjust the time base to show mostly just the +300mv of the Cal-signal the DS2000 will Calculate the RMS to be 283mv ,
See display, I hope that helps understand this scope
Note: I used the Fine Adjust of the timebase to get 39.00us/div
A nice description:
http://masteringelectronicsdesign.com/how-to-derive-the-rms-value-of-pulse-and-square-waveforms/
Teneyes, thanks about the triggering info. The mastering electronics link confirms that a unipolar square (i.e. pulse) has more RMS than simply VP in link's final equation (5). A bipolar square has simply VP in RMS (10).
The probes look cool when fitted with black noses by the way.

I had those as spares, got them dirt cheap from Ebay a while ago. Push harder to hear a click for proper fit like with the originals.
Put a HP 3478 multimeter on the probe test points of the Rigol 2072,
got 1.48 V on DC
got 1.48 V on AC
On the Rigol 2072,
got rms 1.48 on AC
got rms 2.08 on DC which is not correct
rms gives same Power in the same R, as a DC voltage of that value.
Your DMM measured AC (RMS) and DC (average), but not AC+DC RMS which is what the scope is doing when DC-coupled.
AC+DC RMS is = sqrt(AC^2 + DC^2)
You can think if it this way, a square wave with no DC offset is always + or - Vp, so would generate Vp^2 / R watts in a resistor.
A "one-sided" square wave with the same amplitude has a voltage of 2*Vp half of the time (and zero the other half), so creates ((2Vp)^2 / R) / 2 = 2(Vp^2) / R watts on average.
Aha, just tested with Mastech 8218 which has AC+DC true RMS mode. Same reading as the scope when DC coupled.

Does anyone happen to have an idea if / how I could make the scope add the two channels with an offset in time between them? Like, display Ch1(t) + Ch2(t+T), with T selectable?
It doesn't seem to be possible, but maybe there's some trick I overlooked?

Hey Teneyes, thanks for your effort!
No, nothing like that... I'm specifically interested in having the math function display Channel 1 plus Channel 2, but with different delays between the channels. I guess it's just not possible...
Thanks neverthereless
I'm specifically interested in having the math function display Channel 1 plus Channel 2, but with different delays between the channels. I guess it's just not possible...
Thanks neverthereless
I'm not exactly sure what you're trying to do - but it might be possible to use the delay trigger option to adjust the T between the two channels - if you can satisfy the edge trigger requirements.
NOTE: This DS2072 display data was Manually Created to test the DSO measuring system.
so I can better understand .my first DSO.
THIS IS NOT A REAL SIGNAL The display shows that the measurements are calculated/measured on the data that is displayed.
NOTE that the Sin(x)/x interpolation is applied to the sample data points before measurements as shown by the "Vpp = 7.12V" , the peaks of the Sin ripples ( the data is a step of only 6.0V)
NOTE that the system knows only 2GSa/s is used , so cannot measure under 0.5ns thus rise time is measured as "rise<500ps"
NOTE the difference among Max, Top, and Amp measurements.
This maybe helpful to others to understand this DSO
Another thing now. The digital filter in the 1000 series was handy. Could limit the bandwidth very low, could notch out things etc. Brought ringing to pulse of course but for other stuff like susceptible power lines & motors (to fields, EMI or RFI, so to separate the original harmonic noise) was nice. Do you think that the lack of that menu in the 2000 is completely covered by Hi Res mode series averaging and large memory for instance? Any other settings suggestions for covering those needs?
P.S. Sorry if it has been mentioned before.
NOTE: This DS2072 display data was Manually Created to test the DSO measuring system.
so I can better understand .my first DSO.
NOTE that the system knows only 2GSa/s is used , so cannot measure under 0.5ns thus rise time is measured as "rise<500ps"
NOTE the difference among Max, Top, and Amp measurements.
This maybe helpful to others to understand this DSO
Strange item, the signal seems to be able to look in the future,
before the signal goes up, ther is a reverse ringing, how does the signal
knows that some nSec later it has to go up..?
One interesting thing I've learned while programming RUU is that the Rigol only displays 200 of the 256 possible ADC levels at any given time (mapped to the 8 vertical grid divisions) - even though the entire range is available via SCPI. My newest version of RUU (hopefully will post it tomorrow) has a 'Full ADC' switch - to allow seeing the full range.
Here is a clipped sine wave visible on the Rigol display:

And here is the same sine wave displayed in RUU (with 10 vertical divisions) at exactly the same time:
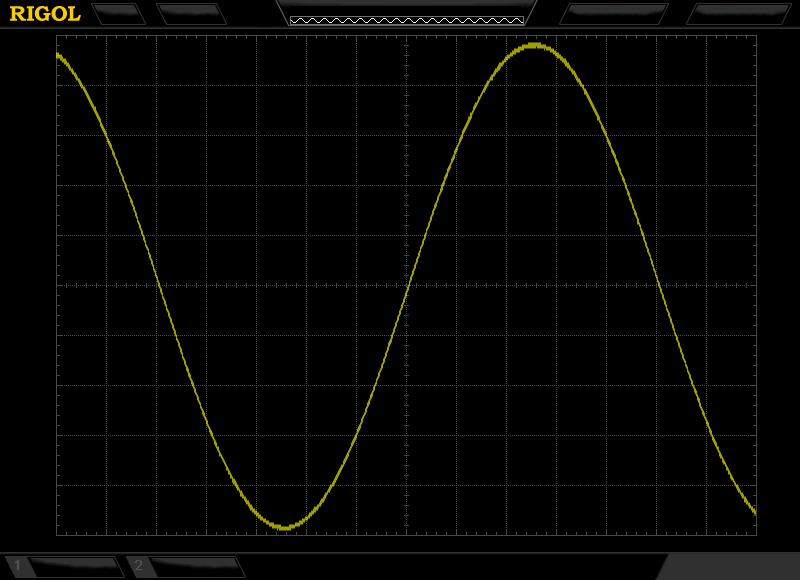
One interesting thing I've learned while programming RUU is that the Rigol only displays 200 of the 256 possible ADC levels at any given time (mapped to the 8 vertical grid divisions) - even though the entire range is available via SCPI. My newest version of RUU (hopefully will post it tomorrow) has a 'Full ADC' switch - to allow seeing the full range.
I own a Agilent DSO1024A scope which is made by Rigol. One frustrating thing when viewing a signal with a large dynamic range (amplitude) was that as soon as a peak jutted out of the viewing window (either the top or bottom) then all the measurements that were impacted suddenly became "*****". So a little "headroom" above and below the displayed window in which measurements could still be taken is a good thing IMO.
The Rigol DS2000 will still measure and display the measurements if >top+25% and < bot-25% , and what Marmad is proposing is only in his RUU. data utility program that the Display be extended to show the complete waveform , Great Idea

When part of the trace is outside the extended range the waveform should show clipped as the measurements affected will show ****.
I own a Agilent DSO1024A scope which is made by Rigol. One frustrating thing when viewing a signal with a large dynamic range (amplitude) was that as soon as a peak jutted out of the viewing window (either the top or bottom) then all the measurements that were impacted suddenly became "*****". So a little "headroom" above and below the displayed window in which measurements could still be taken is a good thing IMO.
Sure, on many low-end scopes the moment your waveform goes off the screen above or below, then all the measurements were inaccurate. So I'm guessing that's one of the reasons that they've done it.
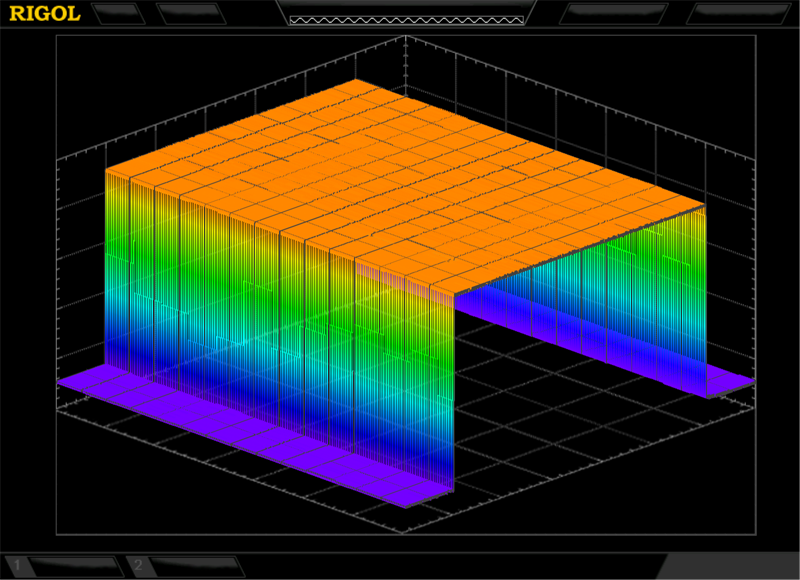
Here is a 3D-plot of a frame array (RUU does this now
) using the Rigol 8-division screen size - showing a square wave set to the boundaries of the screen. In the plot, each square represents two screen squares (i.e. 7 x 4 = 14 x 8 on the screen). Note the white streaks at the top - that is where the square is touching the screen top (and thus activating the white color in the CLUT):

Here is the same data plotted again - although this time using the full data set mapped to 10 divisions (7 x 5):
Here is a 3D-plot of a frame array (RUU does this now ) ]
Man what a great idea to present frames on a 3d plot!
Man what a great idea to present frames on a 3d plot!
Thanks
- it's what I've been planning with RUU all along. But since the memory read bug, I had to devise a different scheme to get to my goal. Now the software can save, load, plot, and play 'frame arrays':

Here's a 2D plot of frames of a voltage-increasing sine wave - using a black body color lookup table:

Here's the same frames plotted in 3D using a 2-color gradient on the Y-axis (Edit: Note the frame order is reversed in this plot - increasing away from the front plane):

Although I do not fully understand the pictures, they are cool. You must be a skilled programmer.
Something I was wondering about after I have had a DS2202 for testing is:
They use the relabled LMH6518, why does Rigol not offer variable gain additional to the fixed vertical scale settings and for this reason the possibility to use the maximum of vertical resolution for any input signal? The LMH6518 has a gain step size of 2dB, which allows additional odd scales beside the standard historical 1 / 2 / 5 scaling.
Same functionallity is also available on my over 6 years old TDS5104B.
Do you mean fractional Volts/Div settings? You can get those by pushing, then rotating the Scale knob.
If you want to call it fractional.... in your case, is it a gain setting at the input amplifier or is it just zooming of already digitized data?