Playing with matplotlib and python. Here I can present tempco plot, captured from eight xDevs.com FX LTZ1000A references (before trim, as is):
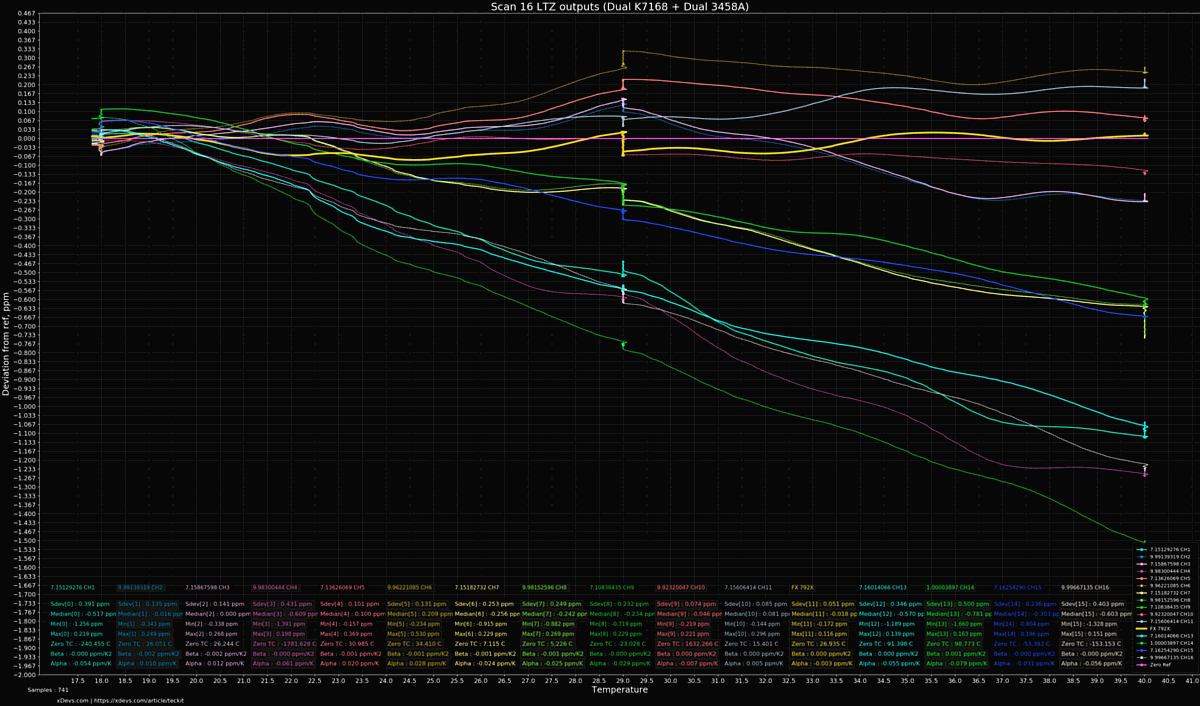
Purpose of the test is to establish baseline for TC before readjustment, to make sure we have no problems with temperature stability. My final goal is to have each ref 10V output deliver better than 0.03 ppm/K.
In test - each reference scanned twice, one value for raw LTZ1000A output (7.x-ish volt) and second value is 10V output (before trim adjustment). Except one output, channel 12 is connected to my xDevs/Fluke 792X FX ref +9.9999779(22) VDC, outside of chamber to verify stability of scanner setup. Worst ref = channel 14, 10V output -0.059 ppm/K.

Scanner = Two Keithley 7168 nanovolt JFET cards. Detector : Two Keysight 3458.
Temperature swept by Keithley 2510 in
DIY airchamber box, with 40W watercooled TEC and Xeon copper fansink inside as heat radiator.
Temperature in the box measured by
Fluke 1529 thermometer and Honeywell RTD PT100 probe.
Used
RAW data file, DSV format.
Python 2.7
app to plot graph. Depends on scipy, numpy and matplotlib.


