I changed roles/companies in work. Out of banks back into exchanges. Breath of fresh air.
Also a breath of fresh air is ... IntelliJ. I'm quite used to Eclipse. IntelliJ and me haven't really got along right, yet. It's even more annoying than Eclipse in many ways I have found so far. It's got so many integrations and add-ons, utility panels and support features, but it seems like none of them are "connected up" together. You can have one build interface showing your a 100% green built and ready project, but your editor shows every import as "Not found". That's just one annoyance that you need to configure all of the support features, sometimes independantly!
To be fair, I'm currently being tried by MCUXpressoIDE from NXP. I needed a few too many pins to make the STM's work, so I'm trying out an i.mxrt1176 (the higher speed doesn't hurt, either - even the "slow" core is almost as fast as the ST one...)
Anyway, long story short.. Come back ST, I forgive everything. Well, most things... A lot... Ok, some. But still...
It tries to do a lot for you, because the chip is actually pretty complicated and the pin routing is also complicated, but then when it fails with an unspecified "error" or "warning" and refuses to update the code from the pin-map UI, you're left with not knowing where the issue is. It 'helpfully' says it's a 'tool error' in the "problems" pane - I ought to spell that "pain") but there's no indication of which preference, which tool, which part of the code, what setup, anything that could point you in the right direction.
It's a bit like STMCube just failing to calculate your desired clock speed (as in: the one the chip is advertised to run at) because the default power-envelope is set to "trickle in power as if it were gold-dust". Again, no indication on the clocking screen why you can't have (eg:216MHz) but 16MHz is apparently your limit...
Anyway, I got "blink a led" up and running pretty quickly on the i.mxrt chip, but a quick test of 'put an interrupt handler in place' is failing dismally. I can see the signal going into the pin, I have the correct pin on the eval board (helpfully shown in the UI), I have the GPIO set to be an actual GPIO not a separate function, and I have the interrupt set up the same as their example one AFAICT. It just won't actually trigger. Most of the above I've done by hand, copying and adapting from example source, because the darn UI has thrown a wobbly and won't update the separated-off areas of the code that it's supposed to [sigh]
And, NXP's forums have been down for days now. All you get when you go to sign in is a "Sorry, this sh*t is broke".
Gah.
Found another workaround for the Cube IDE missing Build Analyser.
It doesn't need a second Build (ctrl-b) really. A right-click on the Debug directory and selecting Refresh does it. The .map file appears then, too.
As a general tip, those "Build profile folders" like Debug and Release are "ephemeral". You can enjoy simply deleting them... or tampering and then deleting.
Usually the "I can't ars'd working out why it's got stuck, rm Debug/ -fr"
Honestly I haven't been in CubeMX in a few months and I recently switched to IntelliJ in work. In Java space in either we don't use "build profiles" like debug and release. I'll not digress beyond we create builds which are environment agnostic and we use 'platforms' to deploy and run them.
It's almost what CubeMX is trying for in ways, but Java and C/C++ are very different animals. "Polymorphic" build artefact platforms do exist for MCU platforms, the trouble is they are usually MCU specific. An arbitrary example might be "ESPHome" and "Platform.io"... although again, they are typically compile/link time controllers. Which is understandable given the targets.
Not happy with 1.13.0...
- Broke my CubeMX script, which cost me blood and suffering to make because docs where close to non-existant.
- eGit detected changes at the beginning of each line in all of my source files, must be a newline thing, no idea what.
- Asks for login to download the firmware pack. From their website:
Authentication
Users familiar with STM32CubeMX will now notice that the software is requiring them to log in to their my.ST.com account before downloading a package. While users always had to enter their credentials when downloading a piece of software from ST.com, the new version slightly tweaks the experience so everything happens within the software for better cohesion. It’s still possible to use STM32CubeMX without an account. However, by asking for a login and password, like on the website itself but from the software, users enjoy a more cohesive experience.
What a pile of BS! Please take your cohesive experience away!
The line-endings is a git setting which if you don't set will modify all the code you commit to meet the line ending requirements of the repo.
This is a bit of a legacy setting, if you are using a modern IDE as they work with all combinations of newlines.
It is intended for people who wish to end "Unix" text files on Windows apps which do not support \n, but only \r\n.
So git has a feature to translate line endings on pull and commit. So you can have a Unix type repo with only \n, but when you check it out on Windows they get translated to \r\n in your local working dir. When you commit them, they get converted back to \n.
The other possible "Oh My God, why is my status showing every file!?", is often as a result of permissions. Usually this is simply disabled on windows and git tracks the unix perms separately. There are ways to configure it and different git clients with different default config and occasionally one of them picks up the windows 777 perms and has a freak out. Also if someone does a mass permission and ownership update in the repo the Windows client can show a massive amount of changes, which appear to have no actual deltas and nothing happens when you pull them.
Hmm it could be the permissions, as I reinstalled Windows and migrated the files from my old installation.
AI doubt it was an actual change on the files or git config, I never had to do anything, worked right away after installing and that's all what I did.
Windows equivalent is setting ”Everyone" owner, exactly the opposite as "nobody" in Linux

V1.13 has not fixed the random file opening... It still opens the file containing code currently running when you stop the target during debug.
It also does oddball stuff I can't put my finger on, and Cube needs to be restarted.
It also breaks a part of the "makefile" concept: it always rebuilds the whole project when you first do a build (say ctrl-b) after Cube was started up. There is a setting deep in there somewhere. Does anyone know where it might be? Basically it run an rm *.* on the whole Debug directory, which deletes all the .o files... obviously
Turn off the debug file opening feature if you don't like it.
In most project IDEs these days we don't even have "save" it just happens, this triggers a build in the IDE in the background. So as you are typing code it's rebuilding it. Eclipse does have manual save, but in Java land it will trigger a build in the background. This can be very progressive inducing as you get the compiler errors immediately in context while you type.
Cube however violates the reasoning behind this by not making any attempt to support "build servers" or "CI/CD". Without these infra components the only build is the build on the developers insecure machine. So making the build process old-school manual and adding "required" IDE integrations to function is the only way to make it work.
Turn off the debug file opening feature if you don't like it.
Where is it? This came up before; there is no option which actually controls this.
Eclipse does have manual save, but in Java land it will trigger a build in the background.
Not in Cube.
Then it won't switch to "DEbug" layout when you hit Debug or when it hits a break point
Yes; we've had this before
Breakpoints not triggering code view of the breakpoint is not very useful.
Then it won't switch to "DEbug" layout when you hit Debug or when it hits a break point
Yes; we've had this before
Breakpoints not triggering code view of the breakpoint is not very useful.
How does it know the ones you want and the ones you don't?
If you disable the automatic switch, you get to choose if you want to go to the Debug view or not.
if it doesn't open the file and advance to the breakpoint, then just click the stack trace for where you want to look.
Note, this is separate to Cube opening "rouge" breakpoints at restart. That is an STM bug with GDB.
i'm fairly sure I disabled it. via the popup which it pesters you with everytime you run Debug asking if you want it to switch. Eventually I decided, says, "No" and saved my choice. All it means is I have to switch manually to debug and back again. Which is fine.
How does it know the ones you want and the ones you don't?
Indeed; this was debated previously, somewhere. Probably on the ST forum... The key to it is to determine whether the trigger for the view change is a user inserted breakpoint, or a reset (or whatever Cube uses to stop the CPU when doing a stop). One would need to dig deep into the java sources.
EDIT: the build-all mode can be fixed, apparently, by changing the Builder Type from External to Internal. No idea what this does, but why does it change?? It should be under Project / Properties, so a Cube update should not change this setting.
Another issue which arrived with v1.13 is that after some tens of seconds it says "trace buffer full". Various suggestions online don't work. The trace buffer is pretty big too, and this is nothing to do with SWV ITM console output.
And now we have 1.13.1 update which, guess what, prevents further updates by removing the update site URL

You have to google for the URL and add it manually.
https://www.jetbrains.com/help/clion/embedded-development.html
Shouldn't you start a new "Is CLion a piece of buggy crap?" thread for this? ;-)
JW
In other partially related news, an
MCUxpresso extension is now available for VS Code. Maybe it will be a piece of (slightly) less buggy crap.
I have installed, it but all my projects are based on custom CMake scripts (apart the RPi pico stuff, I use theirs + mine), so I did not do any real testing.
It was able to understand and compile one of my CMake projects, though not a big deal, it correctly handled all the custom toolchain and picolibc stuff.
That said, even waxed tablets and a broken stylus are better than Eclipse.
That said, even waxed tablets and a broken stylus are better than Eclipse.
Alternatives? Because if it's using olain text editor and/or custom makefiles + setting 20 different programs for everything, no thanks!
Vscode is a mess too, I really hate the interface, plus the json files for everything.
That said, even waxed tablets and a broken stylus are better than Eclipse.
Alternatives? Because if it's using olain text editor and/or custom makefiles + setting 20 different programs for everything, no thanks!
Vscode is a mess too, I really hate the interface, plus the json files for everything.
Sorry, I cannot help you.
If you hate the interface I have no suggestions - it's a very personal thing.
In many years I've tried a lot of different ones all either not configurable enough, or looking like a Win 3 program, or not multi platform, or slow or buggy or all of it at the same time (◐).
VS Code is the only editor/light IDE that managed to make me abandon Emacs, I started at version 0.13 IIRC and never looked back - the only thing I miss are keyboard macros, but multiple cursors cover 90% of my needs.
I like VS (not Code) a lot too, but that's Windows only - not using it much since Code came around.
So attaching the debugger to a running target couldn't be easier.
Set reset type to None, disable downloading - that's all!
Could anyone suggest why I am getting this all the time I restart the target
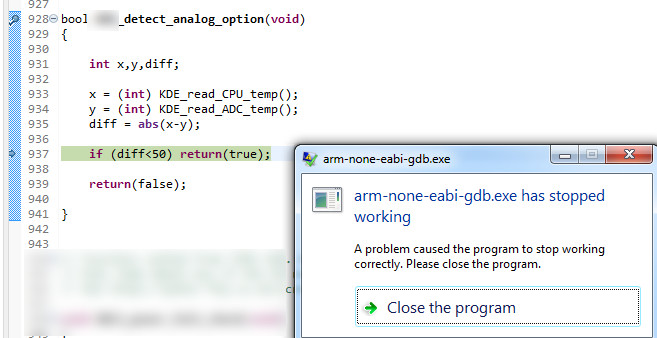
It seems to be clearly related to code I am running. Cube crashes as I step (F6) from the diff = abs... line to the one below.