-
Hello everyone.
I made a similar observation with my TEK FCA3000.
There are differences in the measurement of smart frequency (Continius time stamping) and without this technique as a conventional start stop counter.
I did these tests with my HP Z3805A GPSDO. A 10 MHz output for external reference, the other as the DUT to the input A or B of the FCA3000 counter. I'll show a few images with sample time 1 sec, 2 sec, 5 sec and 100 seconds.
Averaged over the number of samples, a Sample time 5 seconds or more, show exactly 10 MHz at maximum resolution.
-
Hello jpb.
I post a picture from my counter with the three LEDs. There you can see the "trigger a " LED. I don't know if the LCD backlight shines through from behind. This is independent of what I set on the device.
The behavior of the LCD is bad to describe. Everything looks right from the front. From the lateral angle it looks restless. A little as if horizontal, from bottom to top, strips of light go through.
Jörg
-
Hello jpb.
I've not noticed this before, and it doesn't worry me but when I disconnect so the trigger is off then there is a little light bleed so that the trigger looks faintly green as in the attached photo (similar to yours).
I post a picture from my counter with the three LEDs. There you can see the "trigger a " LED. I don't know if the LCD backlight shines through from behind. This is independent of what I set on the device.
The behavior of the LCD is bad to describe. Everything looks right from the front. From the lateral angle it looks restless. A little as if horizontal, from bottom to top, strips of light go through.
Jörg
I'm not sure why your gate light is on with no connection - we must have different settings - I've set mine to measure frequency back-to-back. -
backlight way to powerful maybe you could dim it a little
 mod the circuit ??
-
backlight way to powerful maybe you could dim it a little
Yes, it is rather bright - I poked around the menus to see if it was adjustable and couldn't find any options. mod the circuit ??
I'm a bit reluctant to poke around inside. The brightness doesn't bother me - it is not dazzling - the only concern would be the light burning out prematurely but presumably if there was such a problem with the design it would have emerged by now, it is not a particularly new counter and even in the Tek form it has been around for quite a few years. -
Hello jpb.
I've not noticed this before, and it doesn't worry me but when I disconnect so the trigger is off then there is a little light bleed so that the trigger looks faintly green as in the attached photo (similar to yours).
I post a picture from my counter with the three LEDs. There you can see the "trigger a " LED. I don't know if the LCD backlight shines through from behind. This is independent of what I set on the device.
The behavior of the LCD is bad to describe. Everything looks right from the front. From the lateral angle it looks restless. A little as if horizontal, from bottom to top, strips of light go through.
Jörg
I'm not sure why your gate light is on with no connection - we must have different settings - I've set mine to measure frequency back-to-back.
Hello jpb and thank you for your help.
I see on your picture the easy rest light of "Trigger A" LED is obviously normal.
To the time lights up the trigger LED, without a signal at the input. Depends on if I activate the channel A or B from the menu.
It was on my last photo not so. I don't know why.
Unfortunately, "Back to back" is a mode that is available only at the FCA3100 but not at the FCA3000.
The "Gate" LED lights on without a signal, if "Smart Frequency" is active to "ON" or "AUTO" mode. If I press the "HOLD" button, the "GATE" LED goes out.
If you "Smart Frequency" switches "AUTO" and is under 200 ms measuring time, the device work as a conventional start-stop counter.
If "Smart Frequency" is set to "AUTO" and measuring time is 200 ms or more, the device works as continuous timestampng counter with linear regression.
When measuring times above 2 seconds, the device can operate only in the continuous timestamping mode.
The measurement results with and without "smart frequency" will differ slightly. To show I two statistical evaluations of the FCA3000 at 2 seconds measuring time per sample.
I'm sorry if my English reads slightly strangely. I gotta help me with a translation software.
Jörg
-
Thanks for highlighting smart frequency - you did so in an earlier post and I then checked my counter and found that it was on by default so I turned it off.
I can see that linear interpolation/regression will give a better average frequency value as you are reducing the dependence on the accuracy of the last measured point but on the other hand it makes it harder to determine what is being measured. -
Hello jpb. If you are not an engineer you must read first much on continuous time stamping with linear regression.
For optimal working with this counter, you must acquire much background knowledge. I am not an expert in this field and i wonder about different measurements, depending on equipment setup.
We're talking about very high resolution frequency measurements, which can be adversely affected by many sources of error.
Depending on the type of error, the one or the other measuring methods can deliver better results.
I am still on the search for information, to better understanding this technique.
That between start-stop counting or continuous timestamping counting with linear regression, different results of the StdDev and AllanDev are, I understand quite well.
But that the MEAN result is always different averaged over the set of samples, I still do not understand.
-
Hello jpb. If you are not an engineer you must read first much on continuous time stamping with linear regression.
I am an engineer by background, though I now work in software, and have done quite a lot of work in the past on curve fitting to measured data.
For optimal working with this counter, you must acquire much background knowledge. I am not an expert in this field and i wonder about different measurements, depending on equipment setup.
We're talking about very high resolution frequency measurements, which can be adversely affected by many sources of error.
Depending on the type of error, the one or the other measuring methods can deliver better results.
I am still on the search for information, to better understanding this technique.
That between start-stop counting or continuous timestamping counting with linear regression, different results of the StdDev and AllanDev are, I understand quite well.
But that the MEAN result is always different averaged over the set of samples, I still do not understand.
I think the difference is nothing to do with the source of noise but simply in the way the data is handled. If you have n points going from t1 to tn say, then the standard counter mode will treat this as (n-1) cycles in (tn-t1) seconds or a frequency of (n-1)/(tn-t1). In the linear regression mode the counter fits a least-squares (I'd guess) straight line to the data which may not exactly go through any of the points. The frequency is then the slope of the fitted line.
If you're looking for the best average frequency and assume that the points are all equally noisy then the slope is probably better - the variance in the slope is less than that of the difference in end points. For analysing the data further with ADEV I would guess that you probably want the actual phase measurements since different time periods are used when working on the same data - also some points may be glitches (outliers) and it is probably better to simply remove them rather than allow them to affect the measurements.
I think it is similar to the arguments that photographers have about jpeg and RAW camera data. The jpegs look good straight out of the camera but serious photographers want to work on the RAW data rather than lose information.
I would recommend Bob Riley's web site and in particular his book (available as a free pdf report) and his software Stable 32 which is now also free.
http://www.wriley.com/
http://www.stable32.com/Handbook.pdf -
I've now done the unthinkable and actually looked at the manual!backlight way to powerful maybe you could dim it a little
Yes, it is rather bright - I poked around the menus to see if it was adjustable and couldn't find any options. mod the circuit ??
I'm a bit reluctant to poke around inside. The brightness doesn't bother me - it is not dazzling - the only concern would be the light burning out prematurely but presumably if there was such a problem with the design it would have emerged by now, it is not a particularly new counter and even in the Tek form it has been around for quite a few years.
The LCD screen contrast can be adjusted using the up and down arrows when there is no input expected. It is not the same as brightness but it does allow some adjustment.
Interestingly the screen inverts at one extreme and then I noticed that the screen inverts anyway (white on black) when viewed from an angle (polarisation I suppose). -
I've now done the unthinkable and actually looked at the manual!backlight way to powerful maybe you could dim it a little
Yes, it is rather bright - I poked around the menus to see if it was adjustable and couldn't find any options. mod the circuit ??
I'm a bit reluctant to poke around inside. The brightness doesn't bother me - it is not dazzling - the only concern would be the light burning out prematurely but presumably if there was such a problem with the design it would have emerged by now, it is not a particularly new counter and even in the Tek form it has been around for quite a few years.
The LCD screen contrast can be adjusted using the up and down arrows when there is no input expected. It is not the same as brightness but it does allow some adjustment.
Interestingly the screen inverts at one extreme and then I noticed that the screen inverts anyway (white on black) when viewed from an angle (polarisation I suppose).
Thank you for the information with the arrow keys. However as you already written, results in hardly any practical benefit. When the darker adjust the LCD is very cloudy. Not nice. I have a guess that the backlight of the LCD's is regulated with PWM or so . The technique seems to be somewhat unstable in my FCA3000.
It's good that you're an engineer. I think I may need your help to the understanding of the FCA.
Many greetings. Jörg
-
Hi All
I've just bought a Pendulum CNT-90 but I can't seem to get it to work as expected. I'm inputting a 10MHz square wave @280mv pp from CH1 on my Siglent SDG1025 which is clocked by my BG7TBL gpsdo into the 10Mhz Ext Ref input. The display shows EXT ref to show it has accepted the signal.
The I connected CH2 of my sig Gen to Input A on the CNT-90 and supplied a 10MHz sine wave at 5v.
The issue is that whatever gate speed/resolution I choose, the last couple of digits on the CNT-90 dance around by about 20 counts. I had assumed that if the extref is essentially the same clock, the display should be crack on and the display would be. for example, 10.000 000 000 000 but even on faster gate times like 100mS, the last couple if digits dance around, effectively showing more error for faster gate times.
I've played around with different voltage levels for ext ref and sine/square and while these do make a small difference, the display doesn't zero.
Am I missing something here?
Thanks
Steve
This question also concerns me.
I use an external 10 MHz source and divide the signal, once on the external reference input and once on the measuring input of the Tek FCA 3000 (aka Fluke PM 6690/Spectracom CNT 90)
If I collect measured values over a longer period of time (in this example, 1 second gate time, n = 1500 samples, Trigger "MANUAL) and the mean value I expect exactly 10 MHz, possibly also +/-2 on the LSD.
In my guess I assume that sources of error such as jitter of the 10 HHz source, trigger errors of the counter or other noise have random properties.
This should exclude the fact, that the same deviation is always measured.
But no matter what 10 MHz source I'm trying to do, the FCA 3000 always measures something too high in this configuration.
I'm not sure if I have a mental error or if the counter has a systematic measurement error. I can't find a good explanation for that.
The question is also, which measurement is correct?
The pictures in the Appendix show the statistics with smart frequency activated and below without smart frequency.
With smart frequency, as a continious time stamping counter and linear regression, the error is of course further shifted into the area of some uHz.
But the reading is always slightly higher than 10 MHz. I have repeated this process often. I have never seen a mean value below 10 MHz.
However, this should be the case for random errors. Or??
Perhaps the experts here in the forum can explain this well.
Jörg
-
Hello jpb. If you are not an engineer you must read first much on continuous time stamping with linear regression.
I am an engineer by background, though I now work in software, and have done quite a lot of work in the past on curve fitting to measured data.
For optimal working with this counter, you must acquire much background knowledge. I am not an expert in this field and i wonder about different measurements, depending on equipment setup.
We're talking about very high resolution frequency measurements, which can be adversely affected by many sources of error.
Depending on the type of error, the one or the other measuring methods can deliver better results.
I am still on the search for information, to better understanding this technique.
That between start-stop counting or continuous timestamping counting with linear regression, different results of the StdDev and AllanDev are, I understand quite well.
But that the MEAN result is always different averaged over the set of samples, I still do not understand.
I think the difference is nothing to do with the source of noise but simply in the way the data is handled. If you have n points going from t1 to tn say, then the standard counter mode will treat this as (n-1) cycles in (tn-t1) seconds or a frequency of (n-1)/(tn-t1). In the linear regression mode the counter fits a least-squares (I'd guess) straight line to the data which may not exactly go through any of the points. The frequency is then the slope of the fitted line.
If you're looking for the best average frequency and assume that the points are all equally noisy then the slope is probably better - the variance in the slope is less than that of the difference in end points. For analysing the data further with ADEV I would guess that you probably want the actual phase measurements since different time periods are used when working on the same data - also some points may be glitches (outliers) and it is probably better to simply remove them rather than allow them to affect the measurements.
I think it is similar to the arguments that photographers have about jpeg and RAW camera data. The jpegs look good straight out of the camera but serious photographers want to work on the RAW data rather than lose information.
I would recommend Bob Riley's web site and in particular his book (available as a free pdf report) and his software Stable 32 which is now also free.
http://www.wriley.com/
http://www.stable32.com/Handbook.pdf
Hello jpb.
How did you import the data from your TEK FCA 3100 in the Stable32 software.
Thanks Jörg -
I've only recently downloaded the Stable32 software - I've not had time to do anything with it yet but my understanding is that the format is just text files. (I looked at the software a few years back but at the time it was around $300 and I couldn't justify spending that for hobby use, it has only been free since last December.)
Hello jpb.
How did you import the data from your TEK FCA 3100 in the Stable32 software.
Thanks Jörg
Getting data out of the counter requires the use of remote control I think, e.g. via the USB or GPIB but again I've read how to do it but have not yet had a chance to do it myself (it is easier just to let the counter do the work).
I'll try to set up my counter to measure its own reference and see what I get to compare with your results. -
Hello jpb. Thank you for your help. Please note, BtB is not possible with the FCA3000.
Please disable this function when your FCA 3100 for the comparison of the measured values.
I was also able to determine the influence of the trigger mode.
With the trigger mode "Auto " the count error is slightly lower, but the short-term stability is slightly worse.
If you then set the trigger to "manual" mode, the count error is slightly higher and the short-term stability at ADev is slightly better.
Thanks Jörg. -
Hello jpb. Thank you for your help. Please note, BtB is not possible with the FCA3000.
I have done two measurements. First is back-to-back to show that this goes nicely to zero. The second (which I've not kept running very long) is normal frequency which shows the effect that you've noted - it is too large.
Please disable this function when your FCA 3100 for the comparison of the measured values.
I was also able to determine the influence of the trigger mode.
With the trigger mode "Auto " the count error is slightly lower, but the short-term stability is slightly worse.
If you then set the trigger to "manual" mode, the count error is slightly higher and the short-term stability at ADev is slightly better.
Thanks Jörg.
My best guess is that this is a resolution rounding error. The gate time I set was 1 second with clever frequency stuff turned off. The resolution of the counter I think is around 30 psecs (the resolution it stores data to) - the one off accuracy on my counter is 50 psecs and yours is 100 psecs but I think both only store digits down to 30 psecs. (I may be wrong on this but I remember reading it somewhere in the documentation.)
For a 1 second gate with 1 least-significant-digit being out at the start and end then this would amount to the period being 60 x 10^-12 low with the frequency being roughly 60x10-12 or 6x10-11 too high (for such very small delta (1 - delta)^-1 = 1 + delta). This seems to be consistent with the error shown and if it was rounding it would always go the same way on repeated measurements so shows up in the mean.
With back-to-back the error or rounding only occurs at the start and end of the whole measurement so becomes say 60 psecs in several hours which is insignificant.
Back to back measurements are certainly a good thing to do and even my cheap TTi 930 counter does them though it doesn't interpolate at all. -
Hello JPB. Thank you for your nice post. Maybe I have something interesting for you.
It is also interesting to note the influence of the trigger mode on the last digits of the measurement result.
With trigger mode ' auto ', the measurement result and the Allan Deviation is slightly higher than in the manual mode.
This is also a factor to consider when measuring at maximum resolution. For relatively stable signals from good OCXO, the "manual" mode is probably better.
I think your good explanation, describes ' continuous timestamping ' with regression, in the menu as ' smart frequency '.
BtB (back to back), in your FCA 3100 and also in the CNT91, indicates "zero dead-time ". Probably implemented according to a single-shot principle.
If I have seen this correctly in the user manual for the FCA3100, you can select BtB when pressing the ' Meas ' button. Independent of "smart frequency" Function, if you like. .
Although in the literature, continuous timestamping and zero-dead time are always described in combination, but the manufacturer has separated these functions at FCA3000 and FCA3100 (CNT90 and CNT91).
With the less expensive models of Tektronix, Pendulum and Fluke, you can only switch to continuous timestamping with regression.
I have found some publications about continuous timestamping and I give them in the appendix. Maybe you don't know them and can use them.
Jörg
-
Hi Jörg,
Thanks for the post and links. I've come across a couple of them before (there is also a Tektronix one around) but not the middle one.
I did an experiment to see if the offset was entirely quantization error or not by deliberately introducing some random noise. It does reduce the frequency error but not as much as I'd hope so I think that there is some intrinsic issue with the way the counter rounds or interpolates but it is not large.
Attached are photos showing frequency measurement from my generator locked to the counter reference output (which in turn is locked to my GPSDO). Adding random noise frequency modulation reduces the error in the mean frequency by about 1/3rd. -
Hi jpb.
As you can see again, high resolution does not always mean highest accuracy. The meter always remains a device with real 12 digit/second.
Based on your assumption of rounding errors, I have played around with different gate times.
I think there is a mathematical correlation between the TimeBase and the GateTime.
With the "Smart frequency" function on, trigger "Manual", 10 MHz GPSDO as ext ref and at the same time on input B of the counter, i have observed the following:
Measuring times 200 mS, 400 mS, 2 sec, 4 sec, 20 sec, 40 sec, 200 sec... show the 10 MHz on the level of LSD with the slightest deviation.
The error in measurements without "Smart Frequency", could thus not eliminated. "
The more you experiment with it, the more questions arise.
It is interesting how the Agilent 53200/53210 counter behave in this situation.
Greeting. Jörg -
Hi guys, I have a PM6690 unfortunately with the screen broken. Do you know any information on where to get the screen?
-
Its an TM32097AGFG
320x97 dots lcd stated in the service manual page 169, with 2 fpc 20 pins headers, and many voltages to make it work with led backlight.
Not sure it is easily replaceable, unless finding a donor
I think the Tektronix FCA3000, FCA3100, MCA3000 may have used the same lcd's, not totally sure ? -
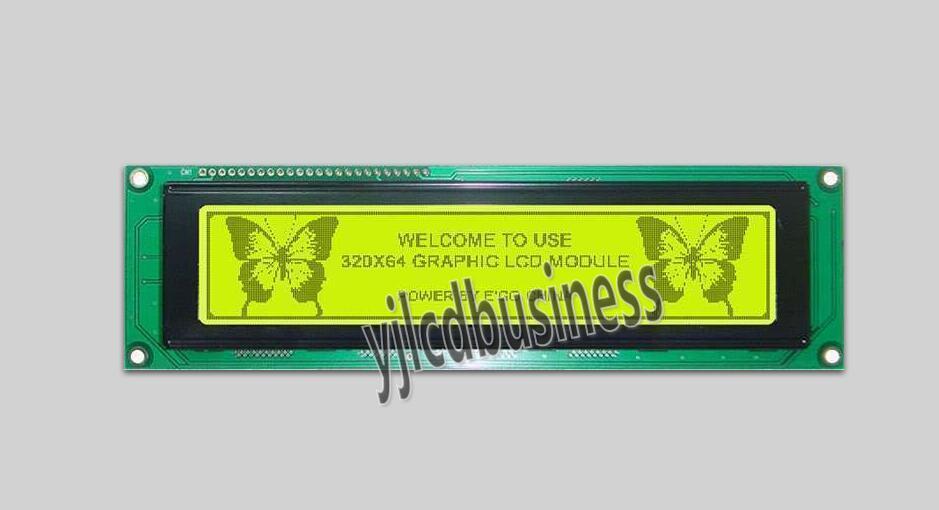
I'm getting closer, I found a 320X64 is missing little.
-
I can confirm, at least, that it's the same as the Tek FCA series screens and the same as the CNT-90/91 screens, since they're all effectively rebadges of the same hardware (seeing the FCA in person just corroborated that). It wouldn't be all that cheap, but there's a chance Tek or Pendulum has a stock of replacements in a warehouse.
If not an official replacement, you may be able to match the input configuration, at least, since the service manual gives you the pinout for the connector. It's worth mentioning that the LCD module seems to use 8 data lines, but the schematic shows four of them grounded and only 4 used. -
Yes, but I do not know where to buy Tektronix parts in Europe. Unlike Keysight, it's as easy as picking up the phone.

I'll have to keep looking. -
In Europe you should probably contact Pendulum, the designer and manufacturer of these devices. Originally a company located in Sweden (split from Philips test instruments) it now resides in Poland. The website is still http://www.pendulum.se