With the trigger level near the top edge of the trace, that's probably why the trigger counter is dropping from 30kHz to 25kHz, one of the edge trigger's hysteresis levels slipping off the top of the waveform.
Maybe, but at 30kHz with 500MSa/s what you see on screen should be what the trigger sees. It should be enough.
It would be good to eliminate that. Turn trigger level down a bit.

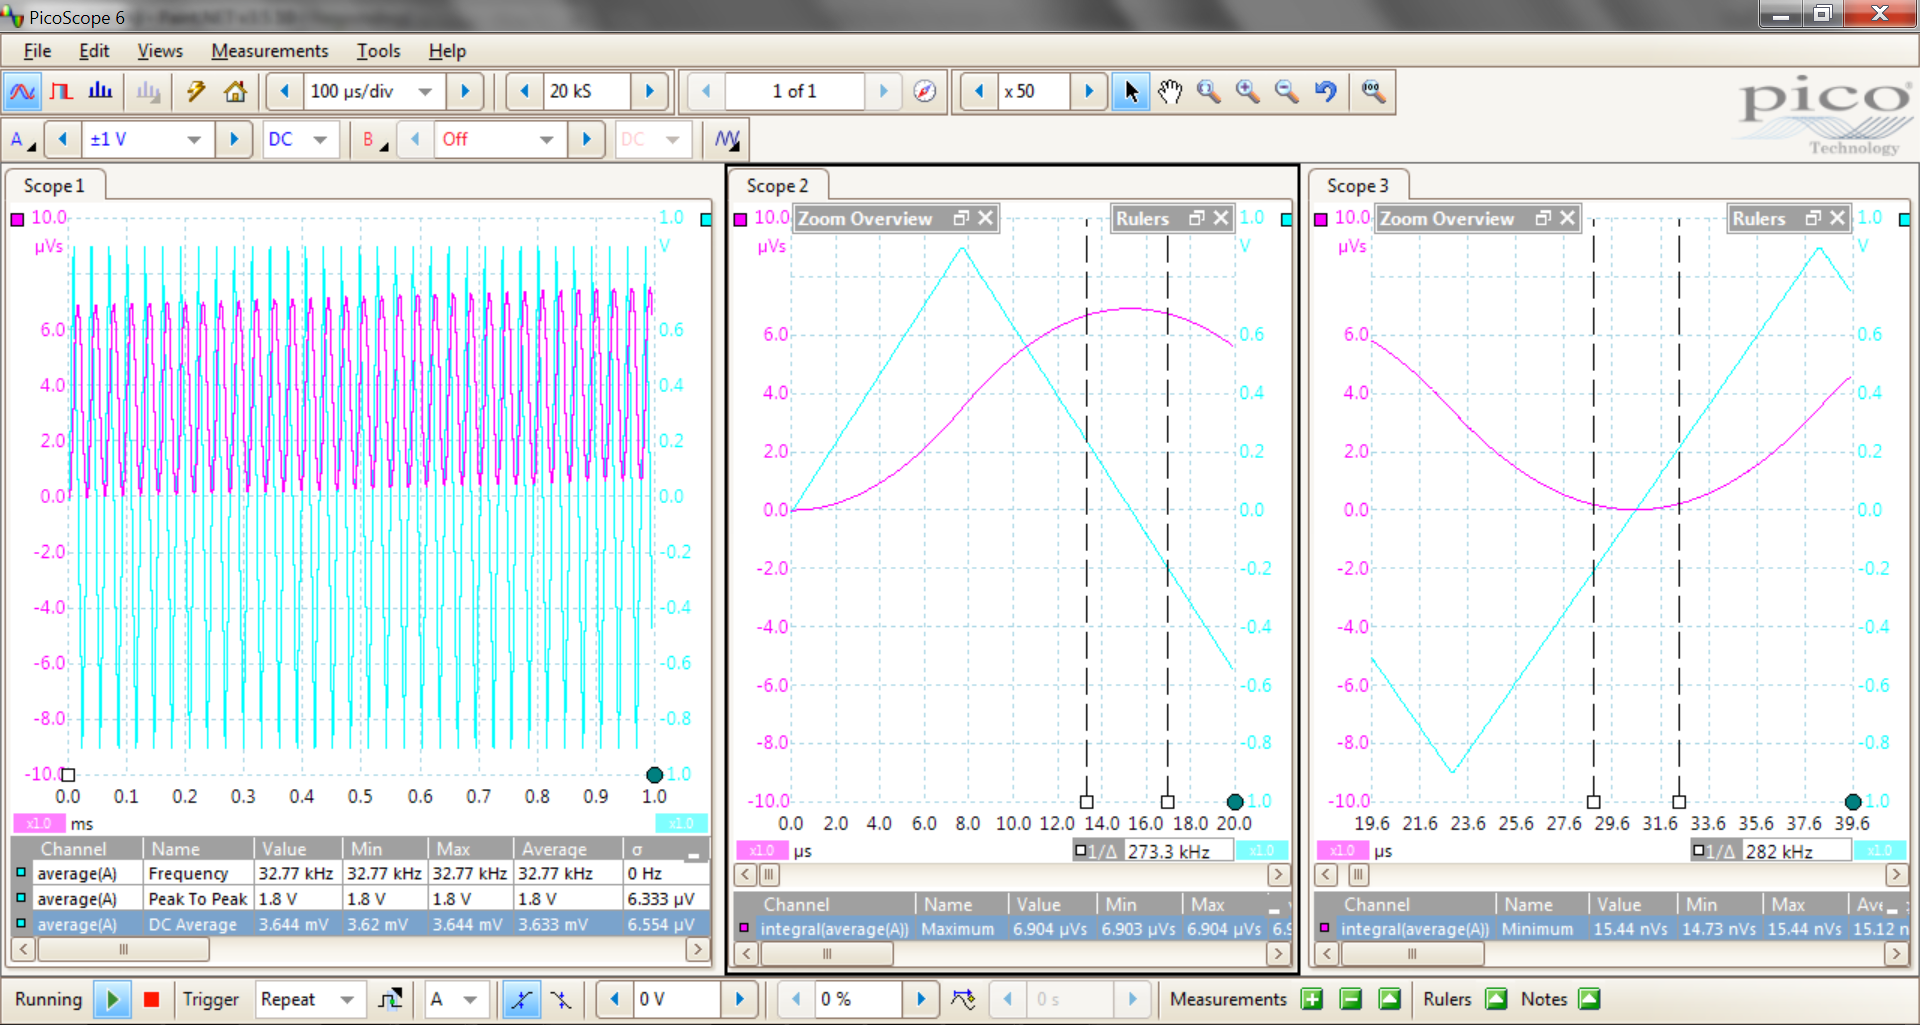
Just looking at the image and doing a finger-in-the-air calculation, it looks as if the area under that wave is very close to zero.
(ie. roughly summing the rectangles shown here)

The number shown on screen is in nanovolts/s, ie. very close to zero. That matches the observation.
It's perfectly possible that halving the sample rate gives a slightly less stable number, and, when it's that close to zero it looks like a bigger error than it really is.
(ie. jumping from +250 to -140
looks like a big error but it really isn't when you realize it's
nanovolts on a 1V signal)
Conclusion: Not a bug, not an error, just noise.
The Area statistic remains relatively stable.
Makes perfect sense.
Noise, enough to affect even the sign of the reading, caused simply by turning on one other channel? And removed by turning on another channel? That's a bug.
I do realize I'm dealing with tiny differences between small values and I'm using an inadequate instrument for the purpose, but I'm trying to get the best most reliable result possible under the circumstances. If this waveform or similar ones from this project can be shown consistently to be "negative" in area, even by a tiny bit, that would justify deploying the "big guns" for a further examination at greater and more reliable precision.
I do know what you mean about noise though. When doing the integration using the Math trace, even on a channel with no input the result will climb or sink randomly when it should be flatlined horizontally.
Noise, enough to affect even the sign of the reading, caused simply by turning on one other channel? And removed by turning on another channel?
Let me reword that:
It's not "noise caused by turning one another channel", it's
"a slightly different numerical result caused by lowering the sample rate on a channel"..
How big an error? It's down in the background noise level.
That's a bug.
Nope, sorry.
I'm dealing with tiny differences between small values and I'm using an inadequate instrument for the purpose, but I'm trying to get the best most reliable result possible under the circumstances. If this waveform or similar ones from this project can be shown consistently to be "negative" in area, even by a tiny bit, that would justify deploying the "big guns" for a further examination at greater and more reliable precision.
Instead of big guns get a small complementary gun of your own. You need something 8bit that has good floating point math (averaging!) or something with high bit count. Since frequencies are very low id say AD2 or PS 2204A which costs about as much as single good probe. They have nothing on Z for high freq work and Z has nothing on them where your interests lie.
Edit: I did look briefly what AD2 and my old PS 2205 offer here. PS does not have built in "area" functions, but does integrals and derivatives. AD2 has nothing like that built in, or I did not find it, but it is not a fundamental problem because you can create needed graph function with script straight in the GUI. 2205 has 16k memory while AD2 2x16k. Seems nothing, yet it is all used for calculus which results in somewhat different approach: Find balance between sampling rate and timebase that would fit max amount of wfms. Look for trends.
Example: 1.8Vpp triangle in from signal gen, slight DC offset set. Already simple DC Average measurement shows that there is more stuff above the zero, so does the trend of integral. Peak values taken from first cycle. With more powerful scope you would zoom out even further. Measurement values are much more accurate than 8bit or N pixels because untied from screen resolution and true floating point.
Of course to really get to bottom of stuff like this you would need to measure both voltage and current to account for reactive component.
You could try to zoom further out on Z also to see if there is any trend with integral but resolution would be quite low. Actually your 3 cycles already show a trend, but area measurement on the other hand do not so results are questionable, this is direct result of limited resolution.
I'm trying to get the best most reliable result possible under the circumstances.
Turn on statistics and look at the average value.
(nb. works for most things where "noise" is a factor)
Could anyone confirm what is the latest firmware version for the DS1000Z series.
It appears BeyondRigol may have pulled the 00.04.04.03.05 version?
True, Rigol's firmware distribution policy is really weird. For most devices, Rigol's China / Chinese page is the best resource for the latest firmware versions. Yet, even the China / English language page is not as well maintained. An then - and that's what i really don't understand at all - for some of their instruments there isn't any update/file available on the mentioned server but you can find firmware versions on Rigol's north American site:
https://www.rigolna.com/. For example, the DM30xx and the M300 are such cases. It may indicate that Rigol has terminated support for these instruments, and thus taken the files off their own servers.
I have updated the information section of the first post in this thread to reflect the current firmware version and its location on the rigolna website.
Thanks for maintaining the front page of this thread. I did not check the original posting in a while, but now made changes for the link coming from the firmware thread. It has been pointing towards the part of this thread regarding SW 00.04.04.03.02 onward (p157), but it is now linking to the opening post.
This is a jitter measurement using cursors and statistics, width statistic being examined.
Problem 1) Cursors measure 6.5 uS of jitter, statistics only 3 uS. Eyeball display examination clearly shows it as > 6 uS.
Problem 2) Attempting to print this scope fails, "Disabled Some Operations!" error, after timeout of command "Can operate now".
no picture file created.
Several measurements were made, some produced 6+uS of measurement error between cursor results and width statistic results.
Each measurement stats were cleared, then scope allowed minutes of measurement time.
Here is scope shot -
https://www.dropbox.com/s/jzfwh67ivyejl6t/DSC_0050.JPG?dl=0Regards, Dana.
Dana, check the measurement history to confirm that the statistics are being calculated over all the samples that the display persistence is showing for the cursor measurement. In the screenshot, it doesn't look like the stats included the same set of data.
Dana, check the measurement history to confirm that the statistics are being calculated over all the samples that the display persistence is showing for the cursor measurement. In the screenshot, it doesn't look like the stats included the same set of data.
Those aren't Stats, they're Cursor measurements.
Something's up with the triggering too, probably too much holdoff.Trigger point hidden behind Cursor readout.
He's comparing the cursor measurements with the scope-collected statistics.
Dana, check the measurement history to confirm that the statistics are being calculated over all the samples that the display persistence is showing for the cursor measurement. In the screenshot, it doesn't look like the stats included the same set of data.
I'm going with this. The 'scope isn't measuring what you imagine it's measuring.
bitseeker -
I do not see any setting, other than choice to apply measurement to "screen"
or "cursors", to control sample set. I have it set to screen, and cursor measurement
looks correct. Stats does not.
If the statistics were not examining all sweeps, even if this were true, over time it would,
all things being equal, get a sample for all possible values. Eg. the jitter would produce
multiple samples for same point in time, over long acquisition periods. I have done hours
to see see if the measurement would converge, does not.
Regards, Dana.
Each measurement stats were cleared, then scope allowed minutes of measurement time.
The width measurement is made on the pixels drawn on the screen. If, for whatever reason, the oscilloscope couldn't identify the "Width" value, the statistics are reset.
Most probably, somewhere during the measurement minutes, the oscilloscope displayed a waveform where it couldn't find any "Width". A reason could be, for example, no input signal for a period long enough that the scope made an auto-triggering, thus resetting the stats (if the scope was in trigger mode "Auto"). Or, the generator stopped oscillating for a while, or there were some very short spikes in the signal, short enough to trigger the scope in an unwanted place. For such a long measurement (minutes) a lot of things could go wrong, not necessarily with the scope.
Please redo the test with the trigger on mode "Normal".
Are the statistics correct when the trigger mode is set to "Normal"?
The measurement has always been done in "Normal" trigger.
I also thought my Hi Res setting for acquire might be doing it, so set that
to "Normal" as well.
Signal source is HW PWM, so it should be "reliable". Reliable in the sense continuous
running, the jitter from it not so much. But to your point I will see if I can get a trigger
on a missing pulse scenario. As well on an excessively wide pulse. Also if I have time do
further testing on my Tek 754A.
Regards, Dana.
I couldn't reproduce the error. My min/max measurement stats never reset by themselves.
What is the "Persis. Time" in the "Display" settings?
I can let mine run for a while, but I don't know for how long. For how many minutes did you ran your test?
Infinite for persistence.
I ran tests for several hours, but problem shows up in fractions of a minute.
Regards, Dana.
The measurement has always been done in "Normal" trigger.
I also thought my Hi Res setting for acquire might be doing it, so set that
to "Normal" as well.
Signal source is HW PWM, so it should be "reliable". Reliable in the sense continuous
running, the jitter from it not so much. But to your point I will see if I can get a trigger
on a missing pulse scenario. As well on an excessively wide pulse. Also if I have time do
further testing on my Tek 754A.
Regards, Dana.
Dana,
I tried in Auto and Normal trig. mode.
With shorter acq. memory depths it converges faster (more wfms/sec) but got reasonable results.
Hameg HM8030-6, PW modulation from 25 uS to 30uS, modulation freq 8 - 50 Hz.. via T to both scopes.
What is your modulation freq?
@RoGeorge : You have to reset stats manually.
Regards,
Sinisa.
The modulation is actual jitter in a clock, ESP8266 module.
I just looked at scope, its mem depth was set to "Auto", so I forced it
to 24M. The results narrowed the error, still running. But error still
significant.
When I start a run I do reset stats.
Regards, Dana.
Still can not reproduce.

I put a generator with a square wave modulated FM with noise (in order to simulate your signal), then let it run for about 15 minutes, and it still keep the min and max updated. My "+Width" measurements don't reset.
The only moment when the stats reset on my DS1054Z was when I lower the generator frequency in such a way that only one rising edge was displayed on the screen (a step instead of a pulse). In this case (a raising step with no falling edge on the screen - so no valid "Width" value) I can clearly see all 4 stats displaying "*****". The moment I have at least a full pulse in view on the display, the "+Width" measurement start displaying numbers again, with the max/min values reset. After "*****" is displayed at least once, the stats in that particular measurement are reset. If I press the "Clear" button, all stats are reset.