-
Strange.
I tried again and my .bmp files are around 750 KByte.
In .jpg format they are 120kByte. Both formats are 800 x 480.
I try to send the 3 screenshots in .jpg format.
I hope things are going well now
---------------------------------------------------------------
I see: now the images are oke.
For completeness I append my original questions
I have made some I2C experiments with my nice SDS 1104X-E scope (software version 6.1.33) and have a question about the record length of I2C data.
I send I2C data from an Arduino Pro Mini to a MPC4725 12 bit DAC on slave address 0x64 followed by the update command byte 0x40. After each update 0x40 follow 2 bytes DAC data from 0x00/0x00 to 0x26/0x26 (total 117 bytes, from 0Volt to approx. 0.5V) .
If I decode this data on my SDS 1104X-E I can see only the first 66 bytes in the Long Data window, please see screenshot_1.
Question: is 66 the maximum I2C record length?
Another I2C question I have is about the data in the bottom (blue) data line, please see screenshot_2. Here the time base for the same data is 200usec/div.
As you can see the bottom data line is a fragment of the long data window. If I turn the Y-position to the left to see more data the complete data suddenly disappear, see screenshot_3.
Is this a bug in the scope software?
Many thanks in advance!
-
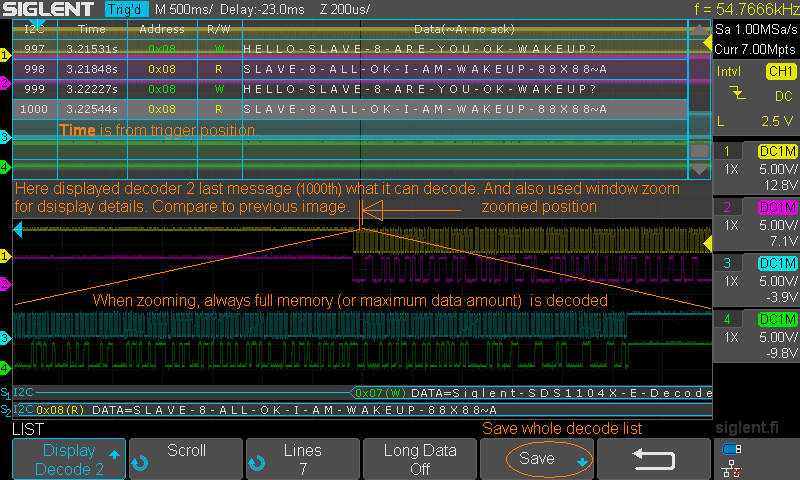
The SDS1104X-E decodes what is in the screen, so if you are pushing the i2c start condition out of the screen, it will not decode.
-
The SDS1104X-E decodes what is in the screen, so if you are pushing the i2c start condition out of the screen, it will not decode.
The workaround is to Decode in Zoom mode but with the main timebase as slow as possible (not ROLL mode) and then examine the decoded data in the zoomed window.
Then in Zoom we can walk the H pos over some 100's of ms of data without problems and still see where we are in relation to the decode trigger position.
The strong clues to this are mem depth on top right of the display, slow timebase settings offer the most memory available where when in Zoom mode we then have a large field to study.
Like with any DSO, the more data we have captured the more we have to inspect. -
The SDS1104X-E decodes what is in the screen, so if you are pushing the i2c start condition out of the screen, it will not decode.
Yes, it decode always full currently used acquisition memory length *) and decoders are software based (so it can decode also from history waveform buffer and from sequence mode saved acquisitions)
*) Acquisition length = display width, always. Whole memory length is always exactly same as display width, independent of if capture length is 7 pts or 14Mpts. There is no overlap part of trace outside of screen.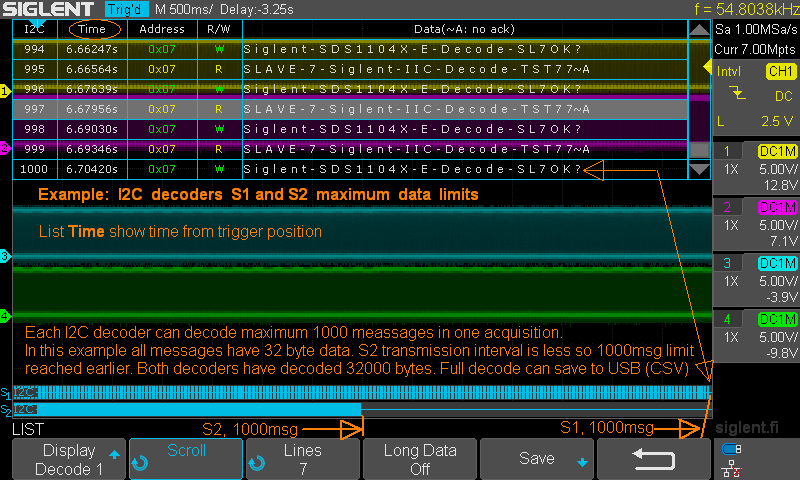
(there is more explanations etc., but only by finnish)
Max amount of IIC messages is 1000 (2 independent IIC decoders, both 1000 messsages max). Independent of if message length is 1 or 32bytes. I have not tested with longer than 32byte messages.
-
Strange.
FYI not all file types can be uploaded directly to the forum:
I tried again and my .bmp files are around 750 KByte.
In .jpg format they are 120kByte. Both formats are 800 x 480.
I try to send the 3 screenshots in .jpg format.
I hope things are going well now
Allowed file types: doc, gif, jpg, jpeg, pdf, png, txt, zip, tar, c, h, hex, bas, xls, odt, asm, wav, aiff, wma, mp3, flac, asc, ods, xlsx, py
Many file types can be converted to the allowed types with various programs like MS Paint or uploaded with a false file extension like .txt and add a note to remove the .txt so they can be used in their native/correct format.
All SDS****X-E models export screenshots in .png to USB and are only some 30-70 KB depending on the scope settings.
If your scope settings have been changed and now not exporting screenshots in .png use the Default button to return it to factory settings.
Later so to not have similar issues use the Save/Recall menu to change/set the behavior of the Default button where you can set your own default settings like V/div, active channels, timebase etc, etc.
You can also reset the Default to factory settings if you make some mistake or change your personal default settings later. -
There is no need to change extensions in the forum. Just zip the "strange" file to .ZIP and you get an official .ZIP file that one can upload. Anyone can download it and store it like that and, later, any program/OS will know how to deal with it. It's a simple operation and involves no "patchings".
-
P60 seems still broken, so...
I posted roughly the following on page 60 of this thread:
With the recent onslaught of new firmware versions for Siglent equipment, most notably the sds1xx4X-E and the sdg2000X, Siglent's published User Guides (and Service Manuals) have become inaccurate in some respects and parts, and in a few cases just wrong
Is anyone working on documenting these changes, perhaps updating manuals or writing addendi?
Is Siglent addressing this issue? -
what part of the manual are you after, what commands or controls?
-
P60 seems still broken, so...
If not they’re about to have a discussion about just that, whether they want to or not....spent some good time today on an email to those that can change things.
I posted roughly the following on page 60 of this thread:
With the recent onslaught of new firmware versions for Siglent equipment, most notably the sds1xx4X-E and the sdg2000X, Siglent's published User Guides (and Service Manuals) have become inaccurate in some respects and parts, and in a few cases just wrong
Is anyone working on documenting these changes, perhaps updating manuals or writing addendi?
Is Siglent addressing this issue?
Yes this has been bugging me too and the issue doesn’t just affect SDS1000X-E documents, as you’ve noticed others too.
-
Right now documentation is their weakest point.
The fate of our times, on the other hand. Poorer documentation and mostly silly videos instead.
-
Strange.
FYI not all file types can be uploaded directly to the forum:
I tried again and my .bmp files are around 750 KByte.
In .jpg format they are 120kByte. Both formats are 800 x 480.
I try to send the 3 screenshots in .jpg format.
I hope things are going well now
Allowed file types: doc, gif, jpg, jpeg, pdf, png, txt, zip, tar, c, h, hex, bas, xls, odt, asm, wav, aiff, wma, mp3, flac, asc, ods, xlsx, py
Many file types can be converted to the allowed types with various programs like MS Paint or uploaded with a false file extension like .txt and add a note to remove the .txt so they can be used in their native/correct format.
All SDS****X-E models export screenshots in .png to USB and are only some 30-70 KB depending on the scope settings.
If your scope settings have been changed and now not exporting screenshots in .png use the Default button to return it to factory settings.
Later so to not have similar issues use the Save/Recall menu to change/set the behavior of the Default button where you can set your own default settings like V/div, active channels, timebase etc, etc.
You can also reset the Default to factory settings if you make some mistake or change your personal default settings later.
Thanks for your quick response!
No big issue but after pressed the Default button and saved the same scope screenshot with all the possible extensions:
.png 751kB
.bmp 1501kB
.jpg 43kB
A very big difference in size. -
To USB stick ?
No big issue but after pressed the Default button and saved the same scope screenshot with all the possible extensions:
.png 751kB
.bmp 1501kB
.jpg 43kB
A very big difference in size.
Tip, use the blue Print button to save directly to a USB stick. Much faster than using the Save/Recall menu path. -
To USB stick ?
No big issue but after pressed the Default button and saved the same scope screenshot with all the possible extensions:
.png 751kB
.bmp 1501kB
.jpg 43kB
A very big difference in size.
Tip, use the blue Print button to save directly to a USB stick. Much faster than using the Save/Recall menu path.
No I saved it via USB and EasyScopeX on my PC. Then in the Virtual Panel right-click and Save As --> the png is 750kByte
But your suggestion 'blue Print button to save directly to a USB stick' did it!
Now the .png file is only 26kB.
Again: no big issue but rather odd and this big EasyScopeX .png perhaps caused the upload problems on page60? -
OK, now instead of EasyScope use the scopes inbuilt webrowser.
To USB stick ?
No big issue but after pressed the Default button and saved the same scope screenshot with all the possible extensions:
.png 751kB
.bmp 1501kB
.jpg 43kB
A very big difference in size.
Tip, use the blue Print button to save directly to a USB stick. Much faster than using the Save/Recall menu path.
No I saved it via USB and EasyScopeX on my PC. Then in the Virtual Panel right-click and Save As --> the png is 750kByte
Utility>I/O>LAN>IP
Turn DHCP ON to get an IP address from your modem then turn OFF.
Enter this IP into your browser bar and hit enter.
Have fun, much more fun !QuoteBut your suggestion 'blue Print button to save directly to a USB stick' did it!
Now the .png file is only 26kB. Quote
QuoteAgain: no big issue but rather odd and this big EasyScopeX .png perhaps caused the upload problems on page60?
Possibly, something we need to check out.
-
For capturing data, the web interface really shines, you can just rapid fire off image captures and they download via your browser skipping the usb step entirely, I believe you can also grab channel data this way, but I've been off on site for a few weeks so I'm working from memory.
-
I investigated the averaging script to see whether it is really possible to extract more signal details.
https://www.eevblog.com/forum/testgear/automated-wave-capture-for-siglent-sds1104x-e-and-sds1204x-e-dsos/
To test this I created a arbitrary waveform with 2 sines superimposed on each other. One only 0.5% of the main sine and 50x the freq. That's sine way "played" at 1000 hz and a 5 V amplitude.
When using the averaging script 0.08V std deviation noise was added, via the combine function C1=C1+C2 on the AWG.
The signal was fetched with 202 segments, which where averaged and plotted in Excel.
In the high res image the second sine can clearly be seen. I think this shows that for a repeating signal this method allows to extract details, without losing the oversight of the signal.
The scripting tool now doesn't use the VISA com-wrappers anymore, but instead uses the Visa32/Visa64 dll directly. Which means USB connection does now work. (The com wrappers where faulty using them). After running some more tests I'll upload the new tool and scripts.
(B.t.w. the screenshots the script takes in PNG format are around 20 kB.)
-
I wondered if it was possible to clean up the imperfections the noise may add to the signal. To do that I captured the noise with another channel and calculated a new average signal, with subtracting the average noise of each sample.
The difference between the two can be seen in the image. The noise (of the noise) can indeed be taken away a bit further. Important to mention is that these details are less than the dac step size.
There're other ways to lower/lift the signal to get sub-step size resolution, but these involve following the scope acquisition cycles. So adding noise is probably the easiest way.
-
I see quite a lot of lag on the screen of my SDS1204X-E with the 6.1.33 firmware when measurements are active. Looks like the trace is paused for maybe a hundred milliseconds while it's taking a measurement and updating the screen. Is this expected? I couldn't find any post in this thread when searching for "lag".
I've filmed the scope to demonstrate. Video here: https://drive.google.com/file/d/1zeJAm1xtiRL67nXrLH39QUYI-IuTzVd4/view
1. The video starts with measurements off. The trace moves smoothly.
2. I click the measure button, with the "all measure" option on, and movement quickly starts to lag. There is a noticeable pause in the trace every time measurements are updated on the screen.
3. I turn off the "all measure" option. Lag is now much much worse, even though there are no measurements visible on the screen, only the trace.
4. I enable the "all measure" option again. Lag only happens when updating measurements on the screen again, like #2.
5. I click the measure button to get out of measure mode. The trace moves smoothly, like #1.
-
While it should not be the case, does the behavior change if you reduce your sample memory size?
-
While it should not be the case, does the behavior change if you reduce your sample memory size?
I just tested, and reducing the memory depth to 1.4M fixes the lag and makes the measurements appear much more often.
Going back to 14M reintroduces the lag instantly.
Am I the only one seeing this behavior? -
Am I the only one seeing this behavior?
No, you're certainly not.
Everyone who is analysing signals at slow timebases on a DSO with long memory and deep measurements will experience some lag - and the SDS1000X-E entry level DSOs are certainly not the worst in this regard, even when compared to instruments that cost 10 times more.
Automatic measurements on the SDS1000X-E analyze the full record length up to 14Mpts. This means that you get the full signal analysis capabilities of a modern DSO, as you can measure e.g. the period, duty cycle and rise/fall times of a PWM signal with good accuracy all at the same time even at a slow 1ms/div timebase.
Some other DSOs use a much shorter secondary buffer for math and measurements, and some are even limited to just the screen buffer, which sets them back to the capabilities of an analog scope where you need to zoom in for meaningful transition time measurements and cannot get even remotely accurate period or duty cycle measurements at all.
-
Thanks for the explanation, Performa01! It's good to know that it's not something wrong with my scope.
From an ignorant users standpoint, the behavior does look like a bug to me. I can definitely understand that it's processing a lot of data, and presenting that data will not always be real time. But as I could clearly see, presenting the data is not a bottleneck in itself, as it's quite fast when the memory length is shorter.
So the fact that the trace lags when updating measurements makes it look like the classic "doing background work on the ui thread" issue. Usually solved by doing time consuming work in the background and updating the ui when done. There could be good reasons for doing it the current way, including technical difficulties or complexity, accuracy (though since it only updates once a sec anyway it's not really representing any current state), or they don't worry about it since no one has complained. -
Thanks for the explanation, Performa01! It's good to know that it's not something wrong with my scope.
Try this and this observed behavior is somewhat different:
From an ignorant users standpoint, the behavior does look like a bug to me. I can definitely understand that it's processing a lot of data, and presenting that data will not always be real time. But as I could clearly see, presenting the data is not a bottleneck in itself, as it's quite fast when the memory length is shorter.
So the fact that the trace lags when updating measurements makes it look like the classic "doing background work on the ui thread" issue. Usually solved by doing time consuming work in the background and updating the ui when done. There could be good reasons for doing it the current way, including technical difficulties or complexity, accuracy (though since it only updates once a sec anyway it's not really representing any current state), or they don't worry about it since no one has complained.
A faster timebase
Another channel using the same ADC.
As Performa01 points out, it's indicative of the sample size processed and additional active channels and/or a different timebase will result in smaller sample size to be processed.
Not all use cases will be impacted....... -
Thanks for the explanation, Performa01! It's good to know that it's not something wrong with my scope.
I understand what you're saying - and I also can only speculate about the reasons.
From an ignorant users standpoint, the behavior does look like a bug to me. I can definitely understand that it's processing a lot of data, and presenting that data will not always be real time. But as I could clearly see, presenting the data is not a bottleneck in itself, as it's quite fast when the memory length is shorter.
So the fact that the trace lags when updating measurements makes it look like the classic "doing background work on the ui thread" issue. Usually solved by doing time consuming work in the background and updating the ui when done. There could be good reasons for doing it the current way, including technical difficulties or complexity, accuracy (though since it only updates once a sec anyway it's not really representing any current state), or they don't worry about it since no one has complained.
On the other hand, I had quite some discussions with Siglent R&D about measurements and I know that they do care - even though quite often I am the only one complaining about something
The fact that it works smooth with 1.4Mpts record length (which you generally should not take for granted) shows that the implementation in the Siglent DSOs isn't that bad after all. Manufacturers usually don't specify the max. data length for math and measurements, but you can bet not many will actually analyze up to 14Mpts. There is one particular (expensive) brand whose DSOs are infamous for getting unresponsive as soon as they have anything demanding (like math or measurements) to do. I'm not sure you'd like such an approach better?
The bottleneck is certainly processing and bus transfer speed as well as the (limited) size of fast internal memory, and embedded platforms (even with the pretty powerful Xilinx Zynq) cannot be compared to a modern PC (which is what upper-midrange and high-end DSOs are based on). We cannot acquire and display new data while analyzing the sample memory at the same time, because the analyzed data need to remain consistent during analysis. With 14Mpts record length, there are "only" 3 records in the history (42Mpts total per channel pair!), hence the currently analysed record gets overwritten by the acquisition process much faster than the CPU can analyse it to get all the measurements. As a consequence, the acquisition process has to be halted until analysis is complete.
A 4 channel SDS1004X-E has a total of 28Mpts sample memory (up to >100Mpts in History and Sequence mode). If we were able to take a "snapshot" of the sample memory, i.e. copy the entire 28Mpts to some internal memory of the ARM CPU (on a separate memory bus) and then analyse it locally in the background, then the interruptions of the acquisition and consequently display process could certainly be much shorter and would most likely not be noticable at all even with 14Mpts record length. But my guess would be that there is just no local memory on a separate bus that is as big as the maximum record length for all channels together (at least 28MB) ...
To cut a long story short, neither the UI nor the display is blocked by the measurements, it is actually the acquisition that needs to be briefly paused in order to prevent it from corrupting the data just being analysed. With shorter record lengths (either by limiting it in the Acquisition menu or selecting a faster timebase) this problem eases pretty quickly.
-
I think you resumed it pretty well.
Just want to add that with the new development toolchains available to these new embedded procs, there is a tendency to have more overhead in all of the code (the tradeoff of faster time-to-market...). This overhead also penalizes the speed.
These equipments are no more compatible with fully Assembly development project (optimized to the extreme).