Thank you!!! Tapping that thin blue button on the top right opened the controls. I had not seen it!
I'd like to read the complete state of the scope using SCPI commands to be able to reload it later on. With most parameters this can be done, but I seem to have found 2 exceptions:
* The visibility of the trace (wether its enabled, but hidden)
* The "Enhanced by bits" parameter of the aquisition.
Maybe I'm missing something? I know a binairy version of the state can be retrieved with a single command, but because that format is not documented, I wouldn't want to take that road. Also when only different parameters values (determined by reading the current state) are set using dedicated commands this is much faster (depending on the number of differences). The saved state should also be editable, thus no simple binairy reading and the writing the same stuff.
Yep, looking at:
https://int.siglent.com/u_file/document/ProgrammingGuide_PG01-E02C.pdfNeither of these seem available.

Email sent to tech support.
I have a Siglent SDS1104X-E hacked to 200 MHz and have installed the WiFi option. At the moment I have no plans to get or use the Arbitrary Waveform Generator (AWG) or the Logic Analyzer (LA) but was wondering, is there any reason NOT to install them? Will it have any negative effect on performance or in some other way? If not, I might as well install them, perhaps in a few years some cheap AWG or LA hardware will turn up on Ebay.
I have a Siglent SDS1104X-E hacked to 200 MHz and have installed the WiFi option. At the moment I have no plans to get or use the Arbitrary Waveform Generator (AWG) or the Logic Analyzer (LA) but was wondering, is there any reason NOT to install them? Will it have any negative effect on performance or in some other way? If not, I might as well install them, perhaps in a few years some cheap AWG or LA hardware will turn up on Ebay.
Not at all however you have 30 free trial uses for any options so they are effectively active already albeit only for 30 uses.
I am liking my hacked SDS1104X-E a lot. Features that I like in comparison with the DS1054Z that I returned include:
- display is a simple 1-1 mapping of the data (no disappearing data in dots mode)
- the heat map "color mode" display looks as if it will be useful
- lower input noise/higher vertical sensitivity
- the built-in web server works well, and it's easy and cheap to add WiFi capability
- able to quickly drop data files/snapshots on my desktop via the web
- the FFT works very well (I've only played around with the calibrator signal)
One thing I would find useful is to have horizontal sweep settings much slower than 100s/division, for data logging. For example I'm just replacing the crappy NiCd batteries & charging circuit in a precision clinometer (Talyvel 4) with a constant current source + battery managament/balance board + 18650 lithium ion batteries. The meter was set to show a "low batt" indicator when either the positive or negative battery rail drops below 7v. I'd like to adjust that threshold to indicate (say) 2 hours of remaining battery life. But what is that? Ideally I would connect one channel each to the positive and negative battery supply, and one channel each to the regulated +-5V internal rails. Then just run it for a day, logging (say) 100 data points/second = 36,000/hour for 10 hours. A quick look at the plots would let me see when the regulated rails drop below 5V, then I can see what the battery voltage is, 2 hours before that.
I'm sure that there are data loggers just for this, and yes I can rig up a script on my laptop to do the logging. But would be nice to just do it on the scope. If there were horizontal sweeps going to 5000 or 10000 secs/division that would do it nicely.
There is one thing what can use for some kind of things. No it is not continuous and it have some limits but. There was long time ago I need watch some system and need know roughly how long it takes when something happen. There 1 second resolution was enough and I have just one oscilloscope for collect data.
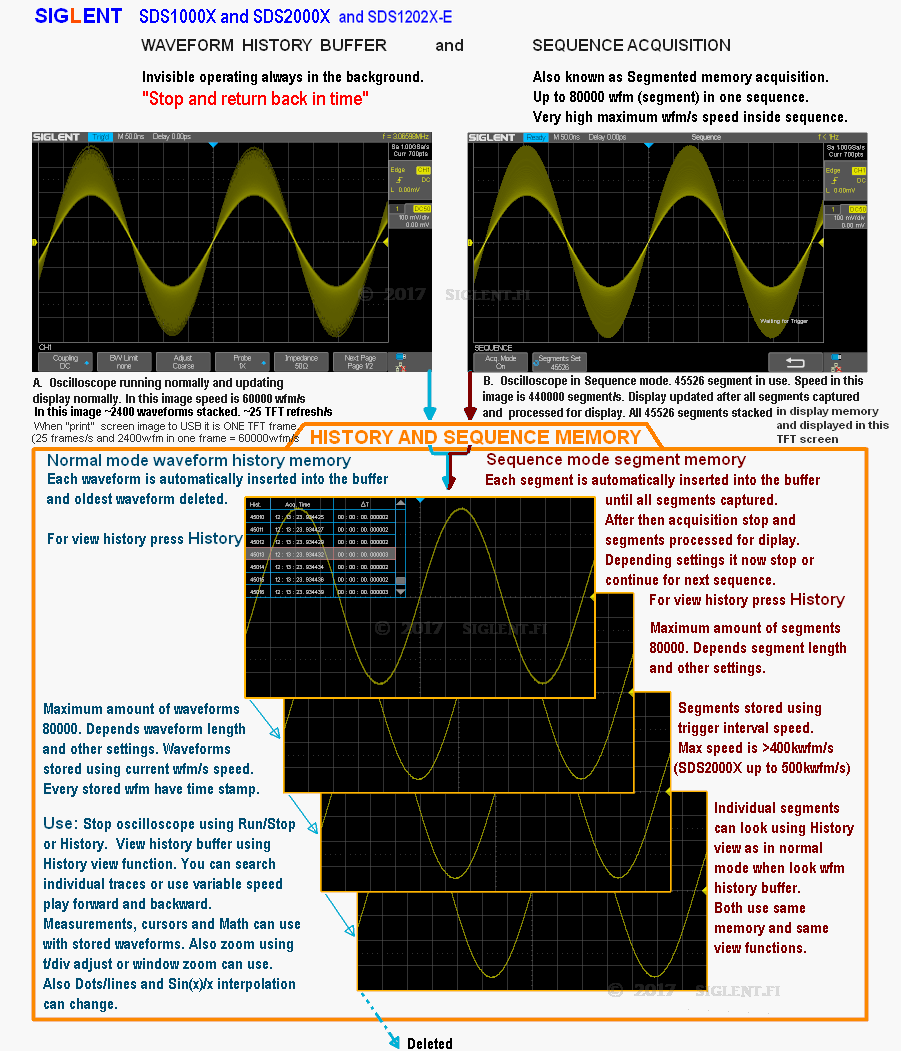
Solution was. Use SDS1000X-E History buffer because I realize I do not need just continuous trace.
There is up to 80000 wfms buffer.
Then I think it is enough I get one mesurement every one second. I need data, not beautiful nice curve or other trend.
Do I need generator what trig scope every second. ... well, no. There are timers in Trigger menu! Example trig Holdoff, up to 1.5s. So just set for 1s and fine adjust for best result.
And if set 10us div then get 140 samples to memory every second. If it is near DC also can look samples average then later after all collected. of course for more short time data log it can adjust very different but always there is some dead time between segments.
After 80000 second memory is full. Then open history and start looking. Also there can see time stamp where can look perfect relative time of these "segments".
One form of "datalogger."
Of course speed, one segment size etc can adjust as need and how is possible. Alone with scope without any extra can do this. Interval can change. Of coutse there is limits and need look what is optimal for needs .. if it is possible depends what is real need.
Just one application hint.
Long time I have wished they add more range for t/div. Just change some parameter in system software, it do not cost "anything". 1000s/div least... if not more. This give over 3.8h continuous data so please least 2000s for some tiny and simple discharge "monitor" or what ever. But this history method have advantage that user can look one segment average.
Maybe you can be tempted to get the right tool for that job like one of these:
https://int.siglent.com/products-overview/sdl1000x/
Given that I might do something like this a couple of more times in my lifetime, not worth it. Also, it's not really the right tool. I want to drain the batteries with the Talyvel (which is not a constant load and drains the +- supplies at a different rate) and monitor the internal supply voltage of that at the same time as I monitor the batteries.
EDIT: I just realised the RF-LOOP has provided a perfect and simple solution!
Solution was. Use SDS1000X-E History buffer because I realize I do not need just continuous trace.
Do I need generator what trig scope every second. ... well, no. There are timers in Trigger menu! Example trig Holdoff, up to 1.5s. So just set for 1s and fine adjust for best result.
And if set 10us div then get 140 samples to memory every second. If it is near DC also can look samples average then later after all collected. of course for more short time data log it can adjust very different but always there is some dead time between segments.
After 80000 second memory is full. Then open history and start looking. Also there can see time stamp where can look perfect relative time of these "segments".
One form of "datalogger."
Thank you, that's a perfect solution!!
EDIT: I've been playing around to get this to work, and realised that I don't understand history/sequence/frames. I've tried to read the manual, but this part is not well written, and I have not figured out how to make this work other than randomly. Is there a written explanation somewhere, or a video online, that demonstrates/explains this? Note: I am coming from the analog/CRT scope world, so this is probably just lack of experience. But I have no internal mental model for how frames/sequences/history works. What's going on under the hood?
EDIT 2: Google searching identified this document, which explains the general idea. But I still need a step-by-step tutorial, and a better mental model of what's going on inside the black box.
https://siglentna.com/operating-tip/siglent-x-series-oscilloscopes-sequence-history-mode/EDIT 3: OK, I learned that in acquire mode you don't see anything on the screen, and with a 1 second holdoff, any adjustments to gains etc take 1 second to shown on the display!
Anyway, by setting a very fast horizontal sweep, I can capture 70 points per sample. So setup AC line as the trigger, holdoff 1 second. Then log voltages on Ch 1-4. Set desired sequence number to max value 80k and start. This logs 70 points every 1 second. 80,000 seconds is 22 hours, which is plenty of time. Then I just scroll through the frames to identify when the voltage has dropped to the desired level.
Solution was. Use SDS1000X-E History buffer because I realize I do not need just continuous trace.
Do I need generator what trig scope every second. ... well, no. There are timers in Trigger menu! Example trig Holdoff, up to 1.5s. So just set for 1s and fine adjust for best result.
And if set 10us div then get 140 samples to memory every second. If it is near DC also can look samples average then later after all collected. of course for more short time data log it can adjust very different but always there is some dead time between segments.
After 80000 second memory is full. Then open history and start looking. Also there can see time stamp where can look perfect relative time of these "segments".
One form of "datalogger."
Thank you, that's a perfect solution!!
I once had some fun with using the scope for very precise ( 0.1 mV precision at around 1.2V) datalogging.
https://www.eevblog.com/forum/testgear/battery-charging-using-a-siglent-sds1104x-and-spd3303x/msg2864724/#msg2864724Just to give an idea what is possible using scripts.
EDIT: I've been playing around to get this to work, and realised that I don't understand history/sequence/frames. I've tried to read the manual, but this part is not well written, and I have not figured out how to make this work other than randomly. Is there a written explanation somewhere, or a video online, that demonstrates/explains this? Note: I am coming from the analog/CRT scope world, so this is probably just lack of experience. But I have no internal mental model for how frames/sequences/history works. What's going on under the hood?
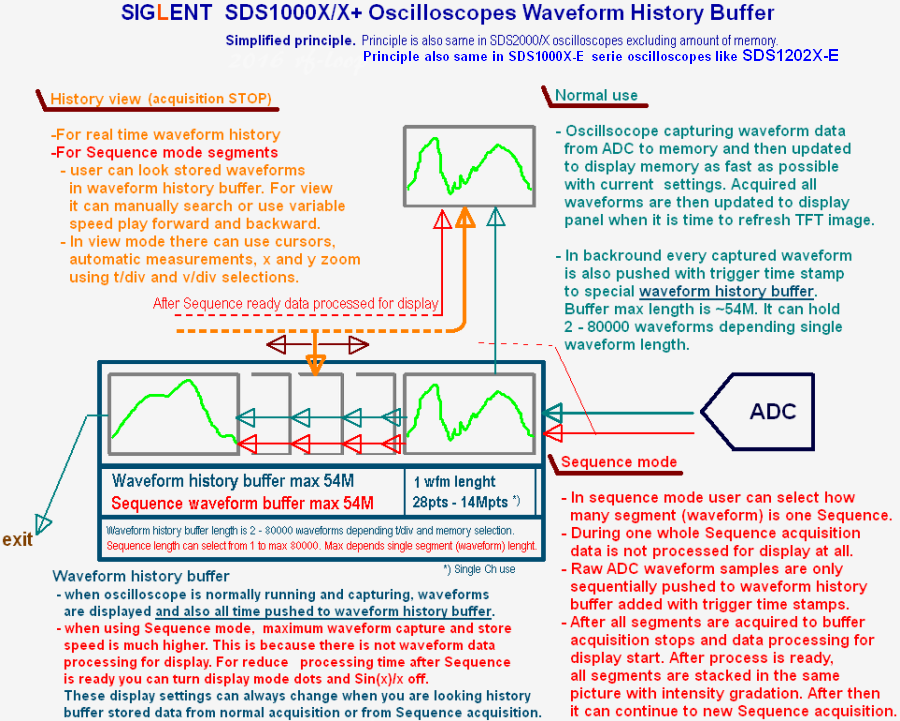
Instead of using the full buffer for one capture, thus one trigger. It handles more triggers by filling parts of the buffer (segments/frames) in sequence.
Analogy:
Instead of taking one photo, its more like recording a movie.
EDIT: I've been playing around to get this to work, and realised that I don't understand history/sequence/frames. I've tried to read the manual, but this part is not well written, and I have not figured out how to make this work other than randomly. Is there a written explanation somewhere, or a video online, that demonstrates/explains this? Note: I am coming from the analog/CRT scope world, so this is probably just lack of experience. But I have no internal mental model for how frames/sequences/history works. What's going on under the hood?
Instead of using the full buffer for one capture, thus one trigger. It handles more triggers by filling parts of the buffer (segments/frames) in sequence.
Analogy:
Instead of taking one photo, its more like recording a movie.
Yes with the invisible 56 Mpt (IIRC) History buffer that runs continuously alongside the 2x 14 Mpts of memory depth.
Simply your s/div setting and its corresponding memory depth determines how many History frames can be filled.
EDIT: I've been playing around to get this to work, and realised that I don't understand history/sequence/frames. I've tried to read the manual, but this part is not well written, and I have not figured out how to make this work other than randomly. Is there a written explanation somewhere, or a video online, that demonstrates/explains this? Note: I am coming from the analog/CRT scope world, so this is probably just lack of experience. But I have no internal mental model for how frames/sequences/history works. What's going on under the hood?
It is explained bit more but unfortunately "scrambled by natural enigma". Our "enigma" is our Finnish language what is said is second difficult after Chinese in world.
In some images there is some english/finglish explanations. But more deep text explanations just with Finnish.
Originally intention have been also make it English but... first I need The Perfect version by Finnish and now it is not this level. Images and text are preliminary versions that have been intended to be improved - later. Partially these are based SDS1000X versions and then SDS1000X-E versions. But one problem have been just this... models after models, FW verssions after FW versions and neve can know what next version change details or add functions and functionality. So these are more or less partially obsolete. Always they are.
But, The Principle is same.
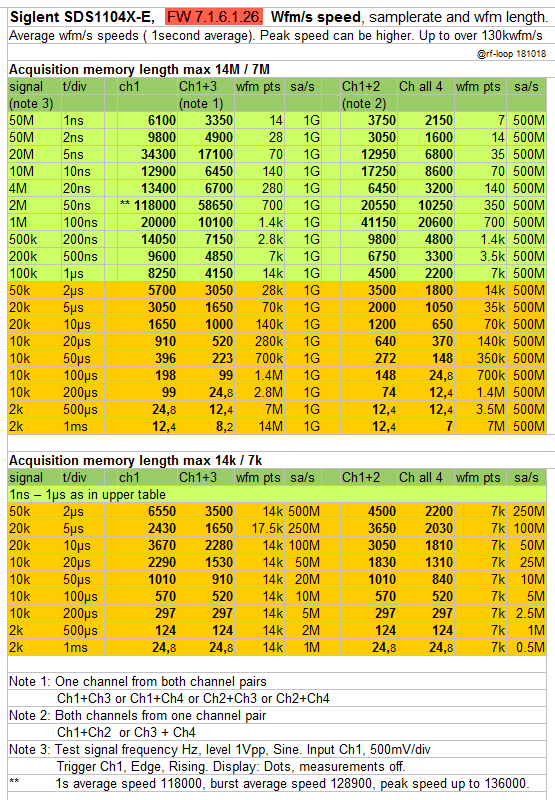
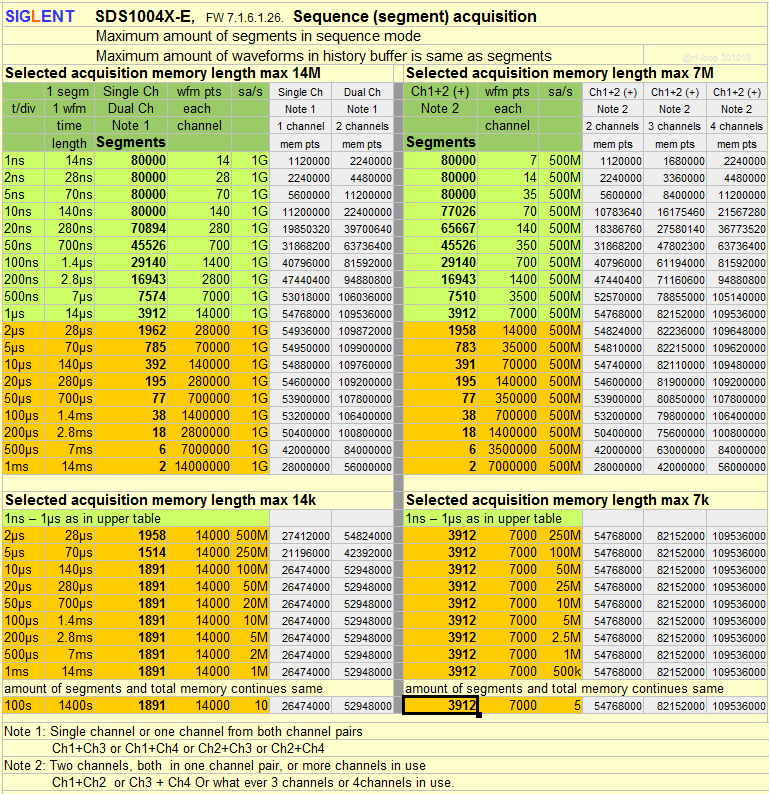
About wfm speed and history/sequence buffer with different settings. txt by FinnishIncluding some wfm speed explanations and tables with some settings about segments and memory and total memory
Most relevat images from there.
Note: If do not need fast sequence, same can do just in normal mode when current wfm speed is enough. BUT there is one exception. If it is important to set perfect number of segments it is not possible in normal mode. History use in this case just max history FIFO length, until you interrupt acquisition after any change before FIFO is full and start overflow.
Every settings change reset FIFO and force start from zero in normal mode. Sequence mode have twi modes, repeating or single sequence.
 Then some explanation about always background working continuous wfm history buffer (FIFO). Txt by Finnish
Most important images from there. Note that principle is same also in SDS1000X-E
ETA:
NOTE: All these tables may have some inaccuracies due to FW changes after these tables made.
This is big problem today. All documents goes to obsolete class faster and faster.
When old times I use some analog scope it stay same years after years, all manuals and verty detailed manuals was more than perfect and errata sheets quite rare.
EDIT: I've been playing around to get this to work, and realised that I don't understand history/sequence/frames. I've tried to read the manual, but this part is not well written, and I have not figured out how to make this work other than randomly. Is there a written explanation somewhere, or a video online, that demonstrates/explains this? Note: I am coming from the analog/CRT scope world, so this is probably just lack of experience. But I have no internal mental model for how frames/sequences/history works. What's going on under the hood?
Instead of using the full buffer for one capture, thus one trigger. It handles more triggers by filling parts of the buffer (segments/frames) in sequence.
Analogy:
Instead of taking one photo, its more like recording a movie.
I wasn't aware of the buffer being used to its capacity in normal mode as well (building up history), that really nice to know!
I saw multiple waves stacked on each other, but never gave it much thought.
The reason for this might be because I don't like fiddling with a scope that much (its location on the bench is not optimal), hence the reason to have it setup with scripts

. Also when I like to inspect a waveform in detail I transfer it to Excel and do the zooming and stuff using Excel. That way one can also get very readable graphs (quantities on axis) with some benefits of being able to add datalabels).
anyone (in Germany) interested on short notice:
Meilhaus has these scopes on sale. (until midnight).
At 437.92€ shipped to italy the 1104x-e! Really good price, best seen. Finally, got one! Thanks for the info!
Can someone here describe *exactly* how the slope triggering works? Because it looks to me like it's buggy.
Here's my setup:
The waveform is an asymmetric triangle wave with a period of about 17 milliseconds, and a voltage range of 3V to just over 5V, with the rising edge taking about 4ms and the falling edge taking about 13ms.
And the trigger definition I'm using is as follows:
Type: slope
Slope: rising
Voltage boundaries: 3.5V to 4.5V
Limit range type: [-- . --]
Limit range values: 1.2ms to 1.4ms
Noise reject: off
Now, if I'm not mistaken about how the trigger setup above is supposed to work, this should result it in triggering *only* if it finds that the signal first passes upwards through 3.5V and then, 1.2 to 1.4ms later, passes upwards through 4.5V, yielding a slope of between 714 and 833 V/s.
The problem is that it is triggering occasionally on the *falling* edge of the waveform. I can easily detect this by setting up a mask and telling it to stop upon violation of the mask. I'm performing the capture at a full 14 million points for maximum resolution. When I zoom in I can see that there's noise, but I'm unable to find noise such that there's a rising edge passing through 3.5V (I am able to see the second one passing through 4.5V some 1.2 to 1.4 ms later, which is that point at which the trigger fired). The latter should be, and is, visible at the trigger point, so the latter condition is being met. But I can't find the corresponding starting point. The voltage at -1.2ms is around 4.66V and at -1.4ms is around 4.70V, so the amount of noise that would be needed for it to see a rising edge passing through 3.5V is at least 1.16V. But the maximum amount of noise I'm able to see in the captured waveform looks to be about 250mV, far less than what would be needed to fire the starting condition of the trigger. As such, I cannot find any reason for the trigger to be firing here. The very definition of the trigger should be immune to false triggering on the downwards slope as long as there isn't a pair of rising edges separated by both the defined voltage difference *and* the defined time differences, something that should be impossible if the maximum noise excursion is well below the difference between the specified voltages. And yet, it *is* triggering in that fashion. The only way to prevent that from happening is to tell it to reject noise, but in light of the trigger definition, that shouldn't be necessary at all ... unless the triggering mechanism doesn't work the way I think it does.
And hence, my question: how *exactly* does the slope triggering mechanism work, and why would it be triggering on noise in the seeming absence of an initial rising edge that meets the defined criteria?
I realize that it's possible for the triggering mechanism to see something that isn't being captured, but this seems to be consistent: I *never* see the starting condition captured in the waveform. I even went to the trouble to export the entire 14M points worth of waveform to a CSV and ran a program to show the minimum voltage seen between -1.4ms and 0ms, and the value I get back is 4.33 volts at -6.432 us. That's well above the 3.5 volts that a rising edge would have to pass through to meet the starting condition requirement. I can attempt to attach the CSV if someone is interested in it, though it's 32 megabytes zipped (the forum might now allow an attachment that large).
Have you checked Holdoff is set to minimum ?
Frequency ? So we can play along at home.
Screenshot using a Run/Stop so we can also see the waveform.
The only way to prevent that from happening is to tell it to reject noise, but in light of the trigger definition, that shouldn't be necessary at all ... unless the triggering mechanism doesn't work the way I think it does.
And hence, my question: how *exactly* does the slope triggering mechanism work, and why would it be triggering on noise in the seeming absence of an initial rising edge that meets the defined criteria?
What is your effective sample rate during your capture? Can you try changing the acquisition mode to 'PEAK' and see if you can capture any relevant noise that way?
Interesting.. Maybe post some screenshots of different zoom levels? (Trigger settings included.)
Have you checked Holdoff is set to minimum ?
Holdoff isn't available with the slope trigger type.
Frequency ? So we can play along at home.
60 Hz. Capture rate is 500 megasamples/sec. I'm using 2ms/div horizontal and 500mV/div vertical.
Screenshot using a Run/Stop so we can also see the waveform.
I'll show that along with the mask. This time I captured using "peak detect", and I've saved the CSV for that as well. Analysis of the CSV shows no real difference with respect to finding the initial condition despite peak detect being used. This time the smallest voltage seen between -1.4ms and 0 is 4.33V, well above the 3.5V or less one would expect to see.
How do I take a screenshot with it showing the menu it was on immediately prior to hitting the "save/recall" button? Whenever I take a screenshot, it always shows the "save/recall" menu itself, which isn't very useful here ...
Have you tried swapping the Level positions ?
See how they are half pointers.....and you're using a rising trigger.
Interesting.. Maybe post some screenshots of different zoom levels? (Trigger settings included.)
I'll do better than that. Here's the CSV from the 14 megasample capture with it in peak detect mode, from -1.4ms to 0ms. It's in the attached zip file. I took the header portion and put it at the top, so it'll look like a full CSV generated by the scope (sans the serial number), but it's actually just a small subset of the full capture.
This CSV corresponds to the screenshot that I just posted, which I'll add again just for clarity.
Tap this button!


